Gideon Weissman
Former Policy Analyst, Frontier Group
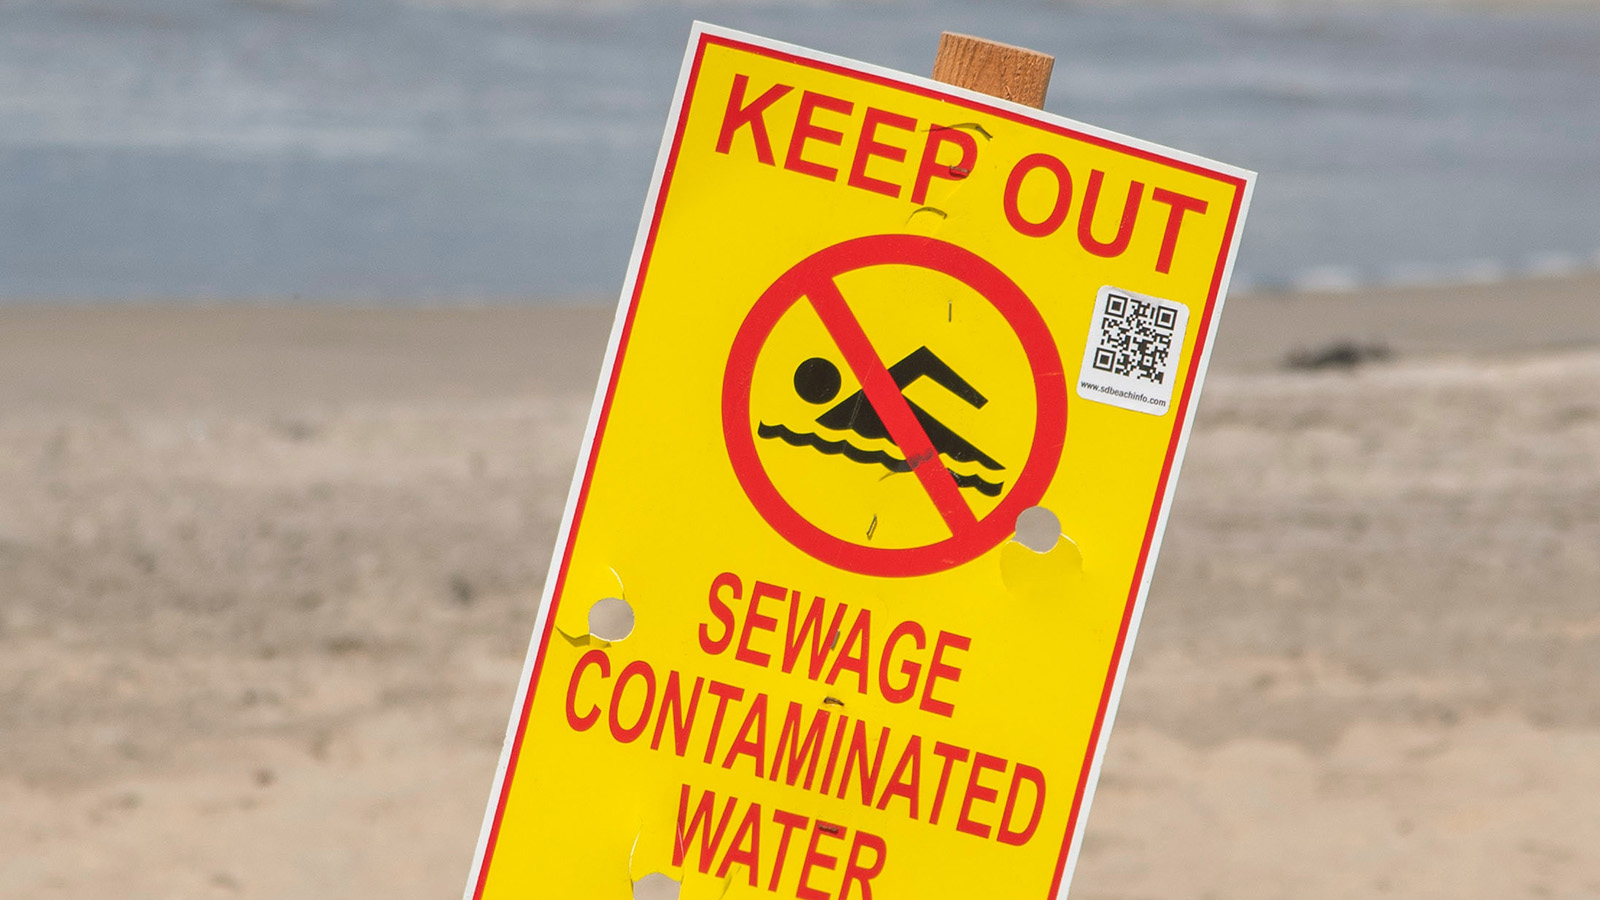
The Clean Water Act, adopted in 1972, set the goal of making all of our waterways safe for swimming. Nearly a half-century later, Americans visiting their favorite beach are still met all too often by advisories warning that the water is unsafe for swimming. Safe for Swimming? assesses water qulity at our nation's coastal and Great Lakes beaches, and highlights strategies for keeping our swimming areas free of dangerous pollution, now and for the future.
The Clean Water Act, adopted in 1972, set the goal of making all of our waterways safe for swimming. Nearly a half-century later, Americans visiting their favorite beach are still met all too often by advisories warning that the water is unsafe for swimming. And each year, millions of Americans are sickened by swimming in contaminated water.
An analysis of fecal indicator bacteria sampling data from beaches in 29 coastal and Great Lakes states and Puerto Rico reveals that 328 beaches – more than one of every 10 beaches surveyed – were potentially unsafe on at least 25% of the days that sampling took place in 2020.1 More than half of all the 3,166 beaches reviewed were potentially unsafe for swimming on at least one day. Beaches were considered potentially unsafe if fecal indicator bacteria levels exceeded the U.S. Environmental Protection Agency’s “Beach Action Value” associated with an estimated illness rate of 32 out of every 1,000 swimmers.2
To protect our health at the beach, policymakers should undertake efforts to prevent fecal pollution, including deploying natural and green infrastructure to absorb stormwater.
Fecal contamination makes beaches unsafe for swimming. Human contact with contaminated water can result in gastrointestinal illness as well as respiratory disease, ear and eye infection, and skin rash.3 Each year in the U.S., people contract an estimated 57 million cases of recreational waterborne illness from swimming in oceans, lakes, rivers and ponds.4
Our beaches are at risk. Runoff from paved surfaces, overflows from aging sewage systems, and manure from industrial livestock operations all threaten the waters where Americans swim. These pollution threats are getting worse with climate change, as more extreme precipitation events bring heavy flows of stormwater.
Of more than 3,000 beaches sampled for bacteria across the country in 2020, 328 were potentially unsafe for swimming on at least 25% of days that testing took place.
Figure ES-1. Average percentage of potentially unsafe beach days in 2020 by county
“Average percentage” represents the average of the percentage of potentially unsafe days at each beach within a county.
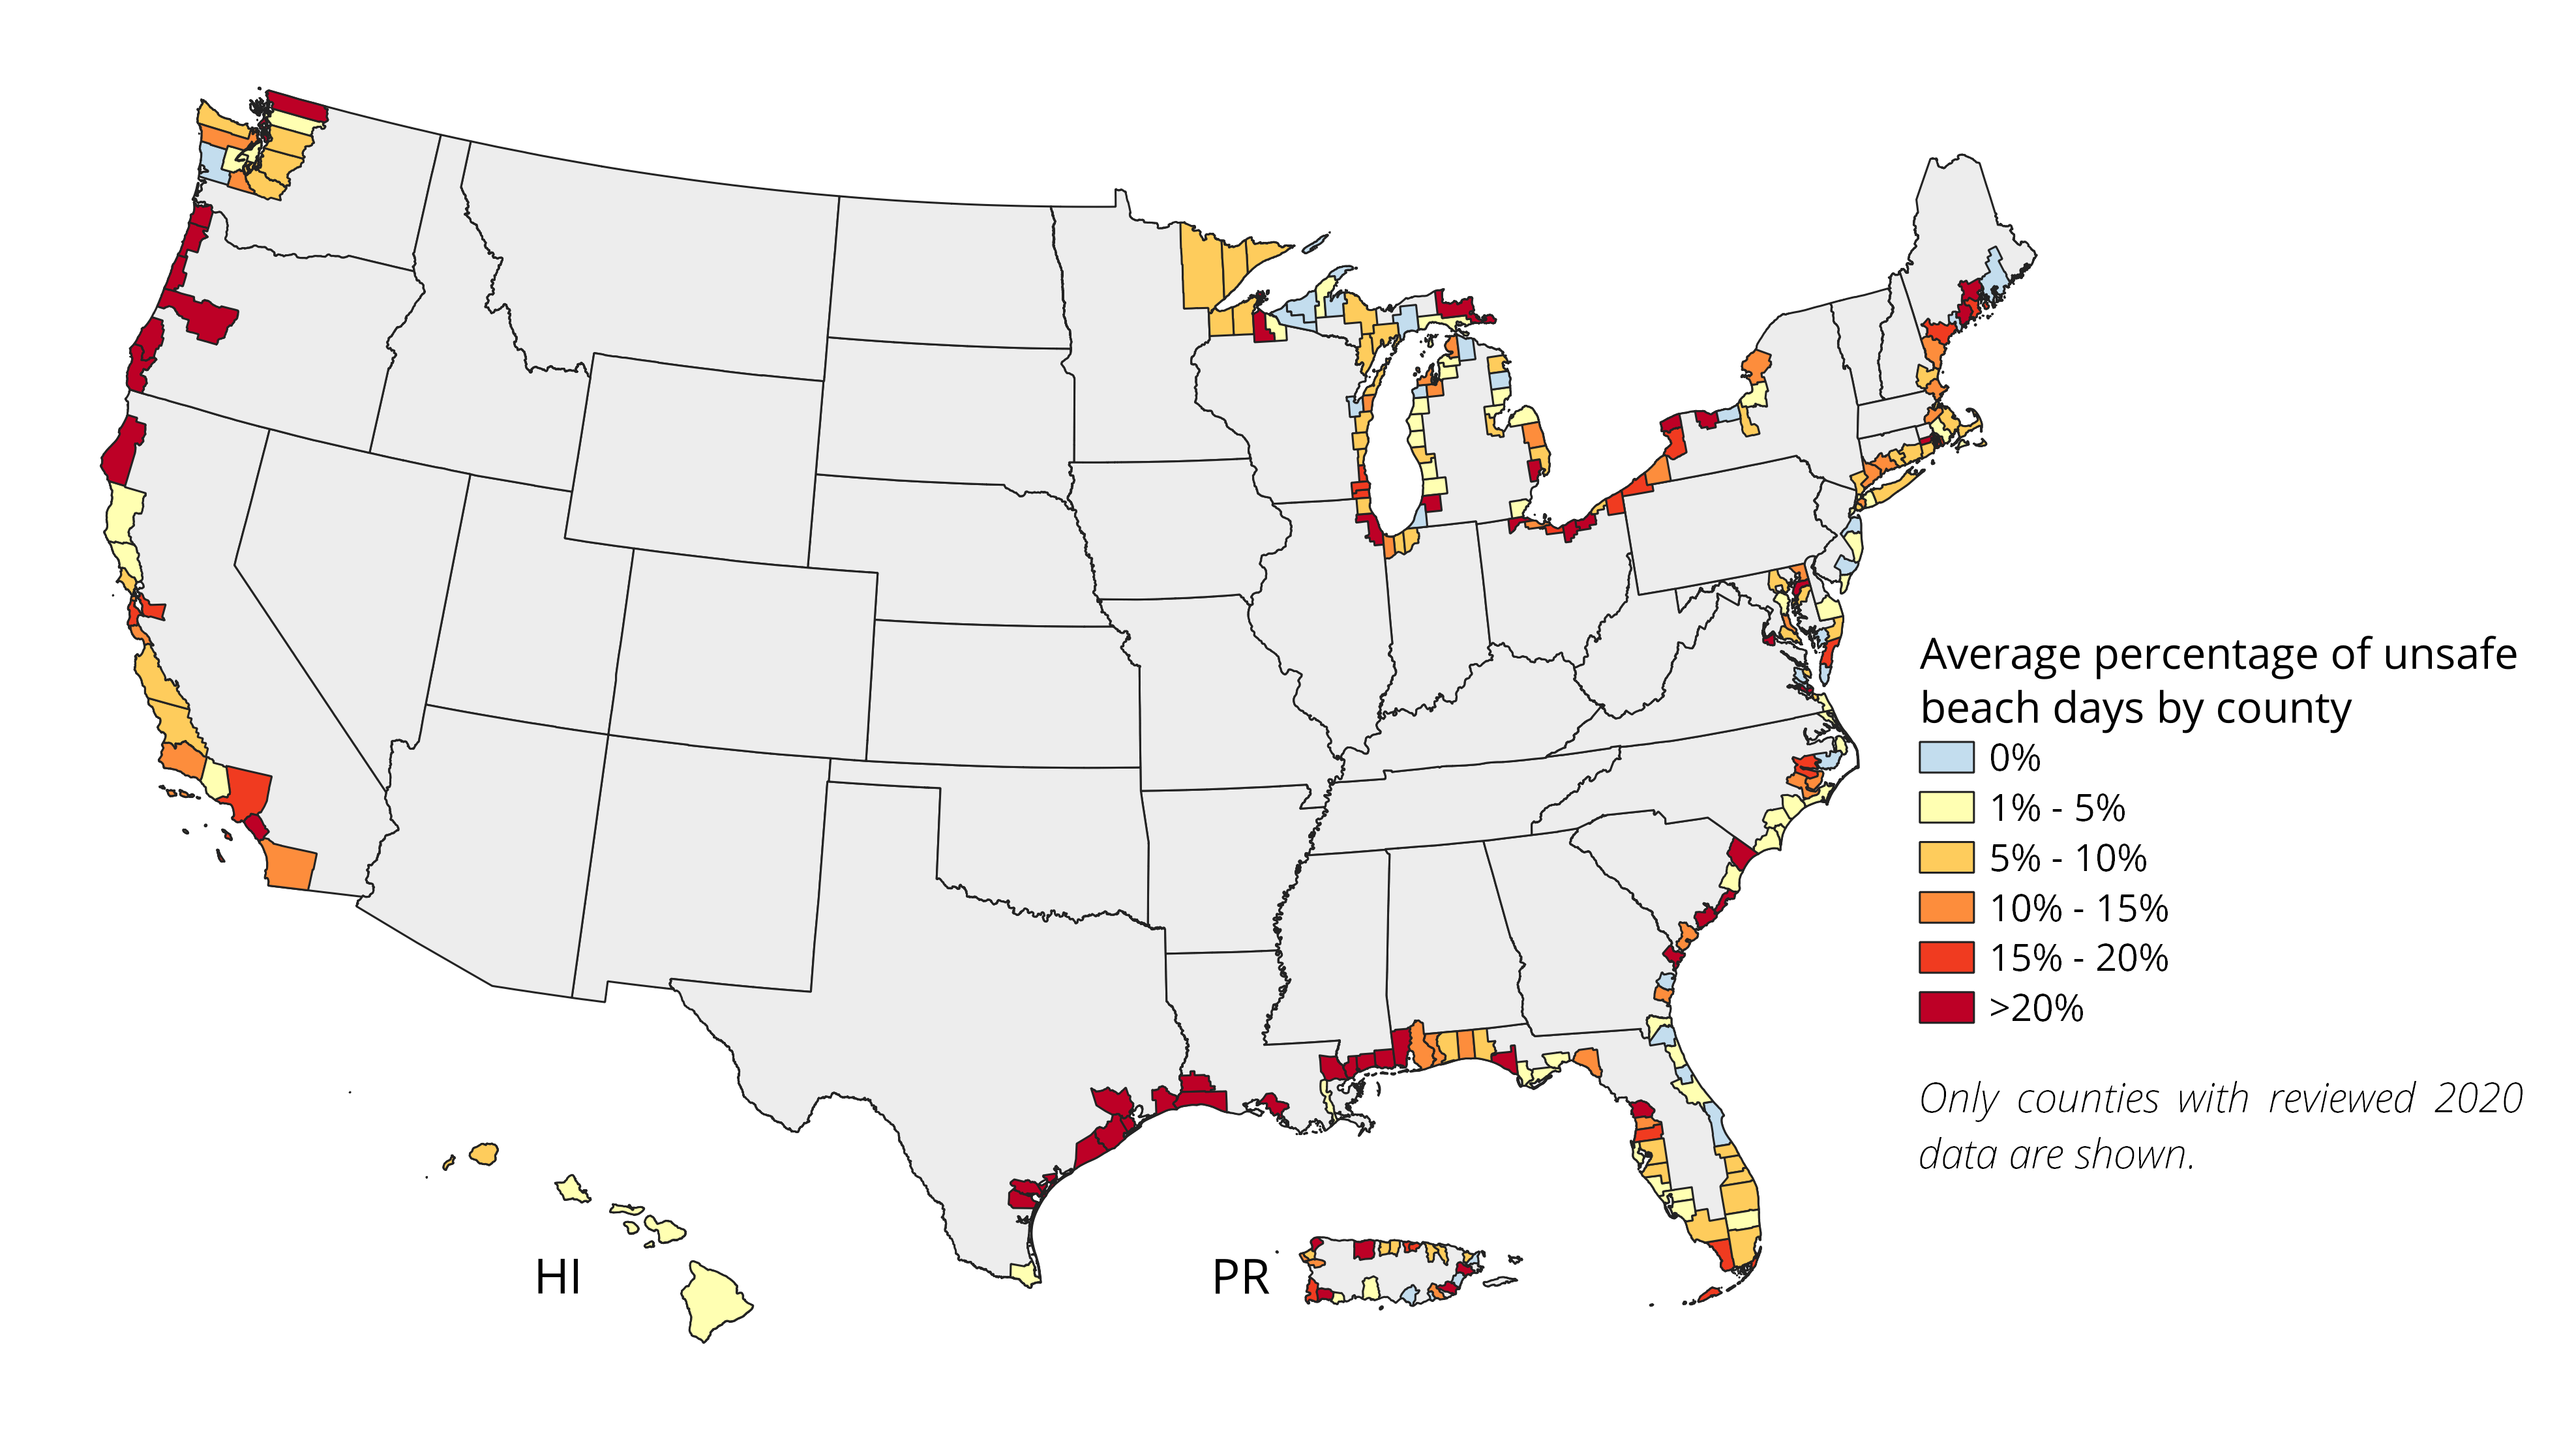
Bacteria testing of ocean and Great Lakes beaches in every region of the country revealed days of potentially unsafe fecal contamination in 2020.
In every coastal and Great Lakes state and in Puerto Rico, sampling revealed potentially unsafe levels of contamination in 2020. (The figures below are based on U.S. EPA’s Beach Action Value. Many states use other thresholds for beach closure and advisory decisions. Therefore, results presented in this report may differ from state reports on beach water quality. See Methodology for details.)
Table ES-1. Every state had beaches with potentially unsafe days in 2020
| State | Beaches tested in 2020 | Beaches with at least one potentially unsafe day | Beaches with at least 25% potentially unsafe days |
|---|---|---|---|
| Alabama | 24 | 21 | 8 |
| California | 258 | 193 | 42 |
| Connecticut | 65 | 46 | 11 |
| Delaware | 23 | 4 | 1 |
| Florida | 266 | 185 | 13 |
| Georgia | 26 | 17 | 3 |
| Hawaii | 218 | 55 | 14 |
| Illinois | 41 | 32 | 12 |
| Indiana | 21 | 18 | 1 |
| Louisiana | 23 | 21 | 10 |
| Maine | 61 | 36 | 15 |
| Maryland | 62 | 34 | 6 |
| Massachusetts | 556 | 264 | 29 |
| Michigan | 196 | 69 | 15 |
| Minnesota | 46 | 23 | 2 |
| Mississippi | 21 | 21 | 16 |
| New Hampshire | 16 | 9 | 3 |
| New Jersey | 210 | 34 | 2 |
| New York | 340 | 172 | 15 |
| North Carolina | 210 | 87 | 7 |
| Ohio | 54 | 49 | 14 |
| Oregon | 19 | 18 | 14 |
| Pennsylvania | 8 | 8 | 2 |
| Puerto Rico | 34 | 28 | 5 |
| Rhode Island | 65 | 30 | 13 |
| South Carolina | 23 | 20 | 7 |
| Texas | 61 | 55 | 31 |
| Virginia | 49 | 29 | 4 |
| Washington | 74 | 41 | 6 |
| Wisconsin | 96 | 70 | 7 |
To ensure that all of our beaches are safe for swimming, policymakers should work to protect beaches from runoff and sewage pollution – including by stopping pollution at its source, and by protecting natural areas. Solutions include:
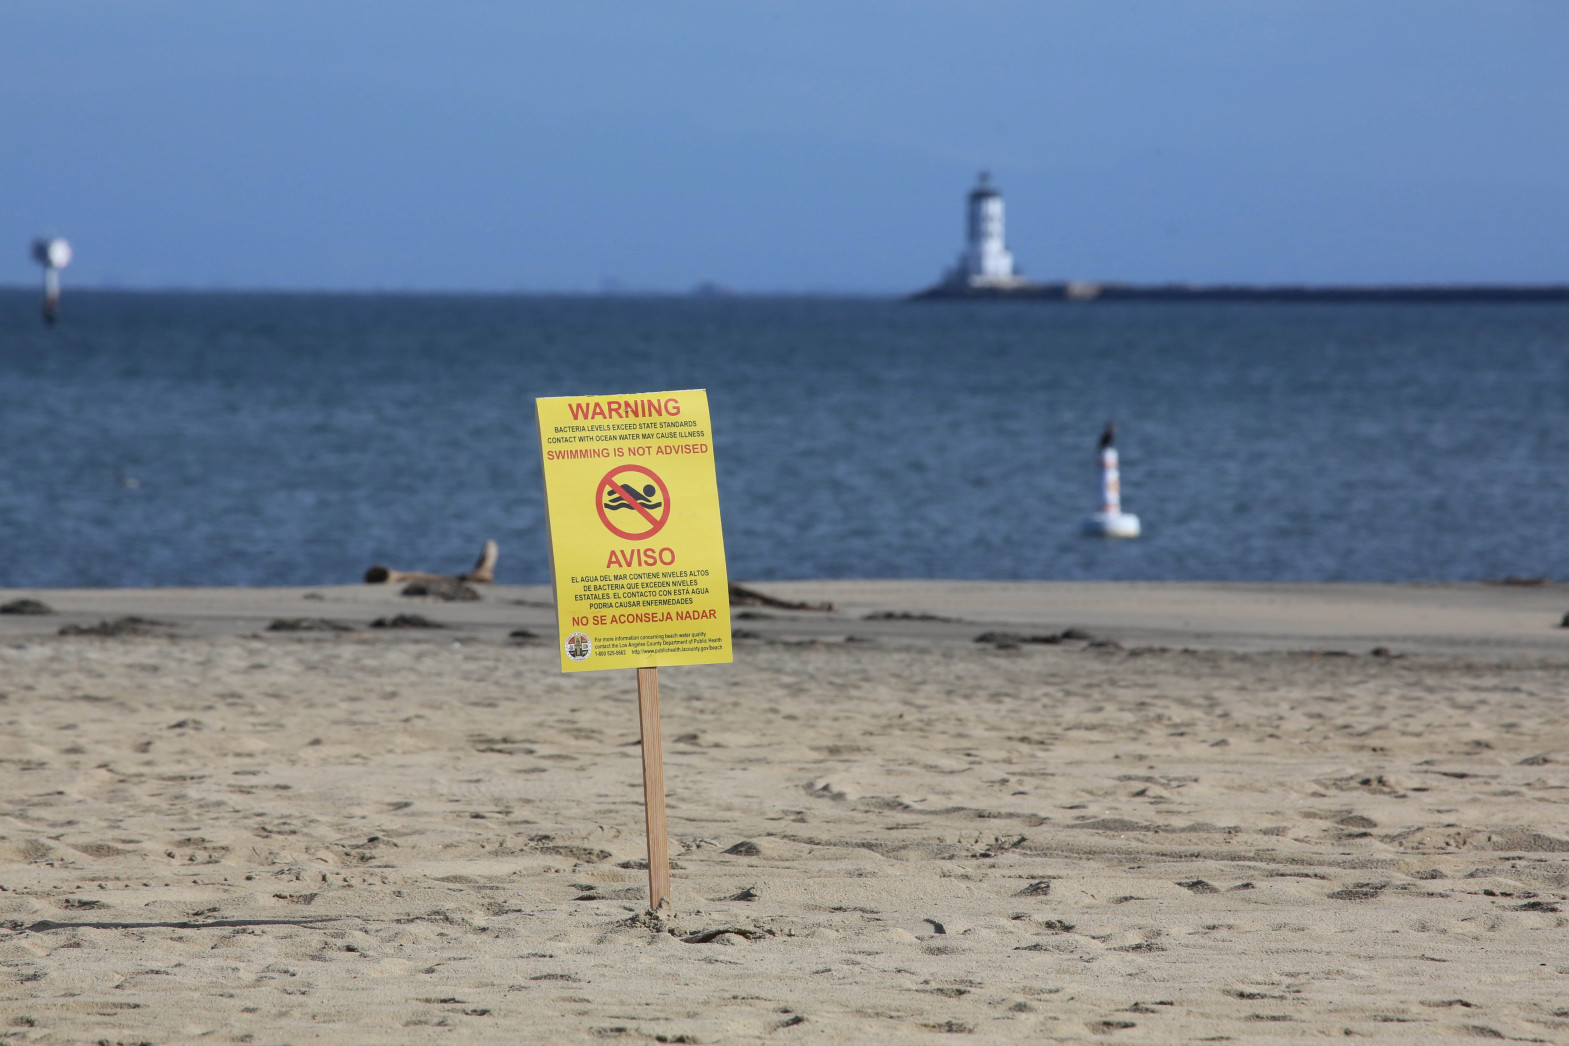
Policymakers should also ensure that swimmers are presented with the best-possible information to make decisions regarding their health. Officials should expand funding for beach testing, to ensure adequate testing at all beaches. States should use EPA’s most protective “Beach Action Value” bacteria standard for making beach advisory decisions and should work to implement same-day bacteria testing and warning systems.
Former Policy Analyst, Frontier Group