
But will the recent surge in driving be sustained? Beneath the topline data, there are a few fascinating data points that don’t quite provide the answers but do suggest some important questions we might ask next.
The Federal Highway Administration (FHWA) is out this week with its final data on vehicle travel for 2016. The new report verifies the FHWA’s preliminary data showing that Americans are driving more than ever before.
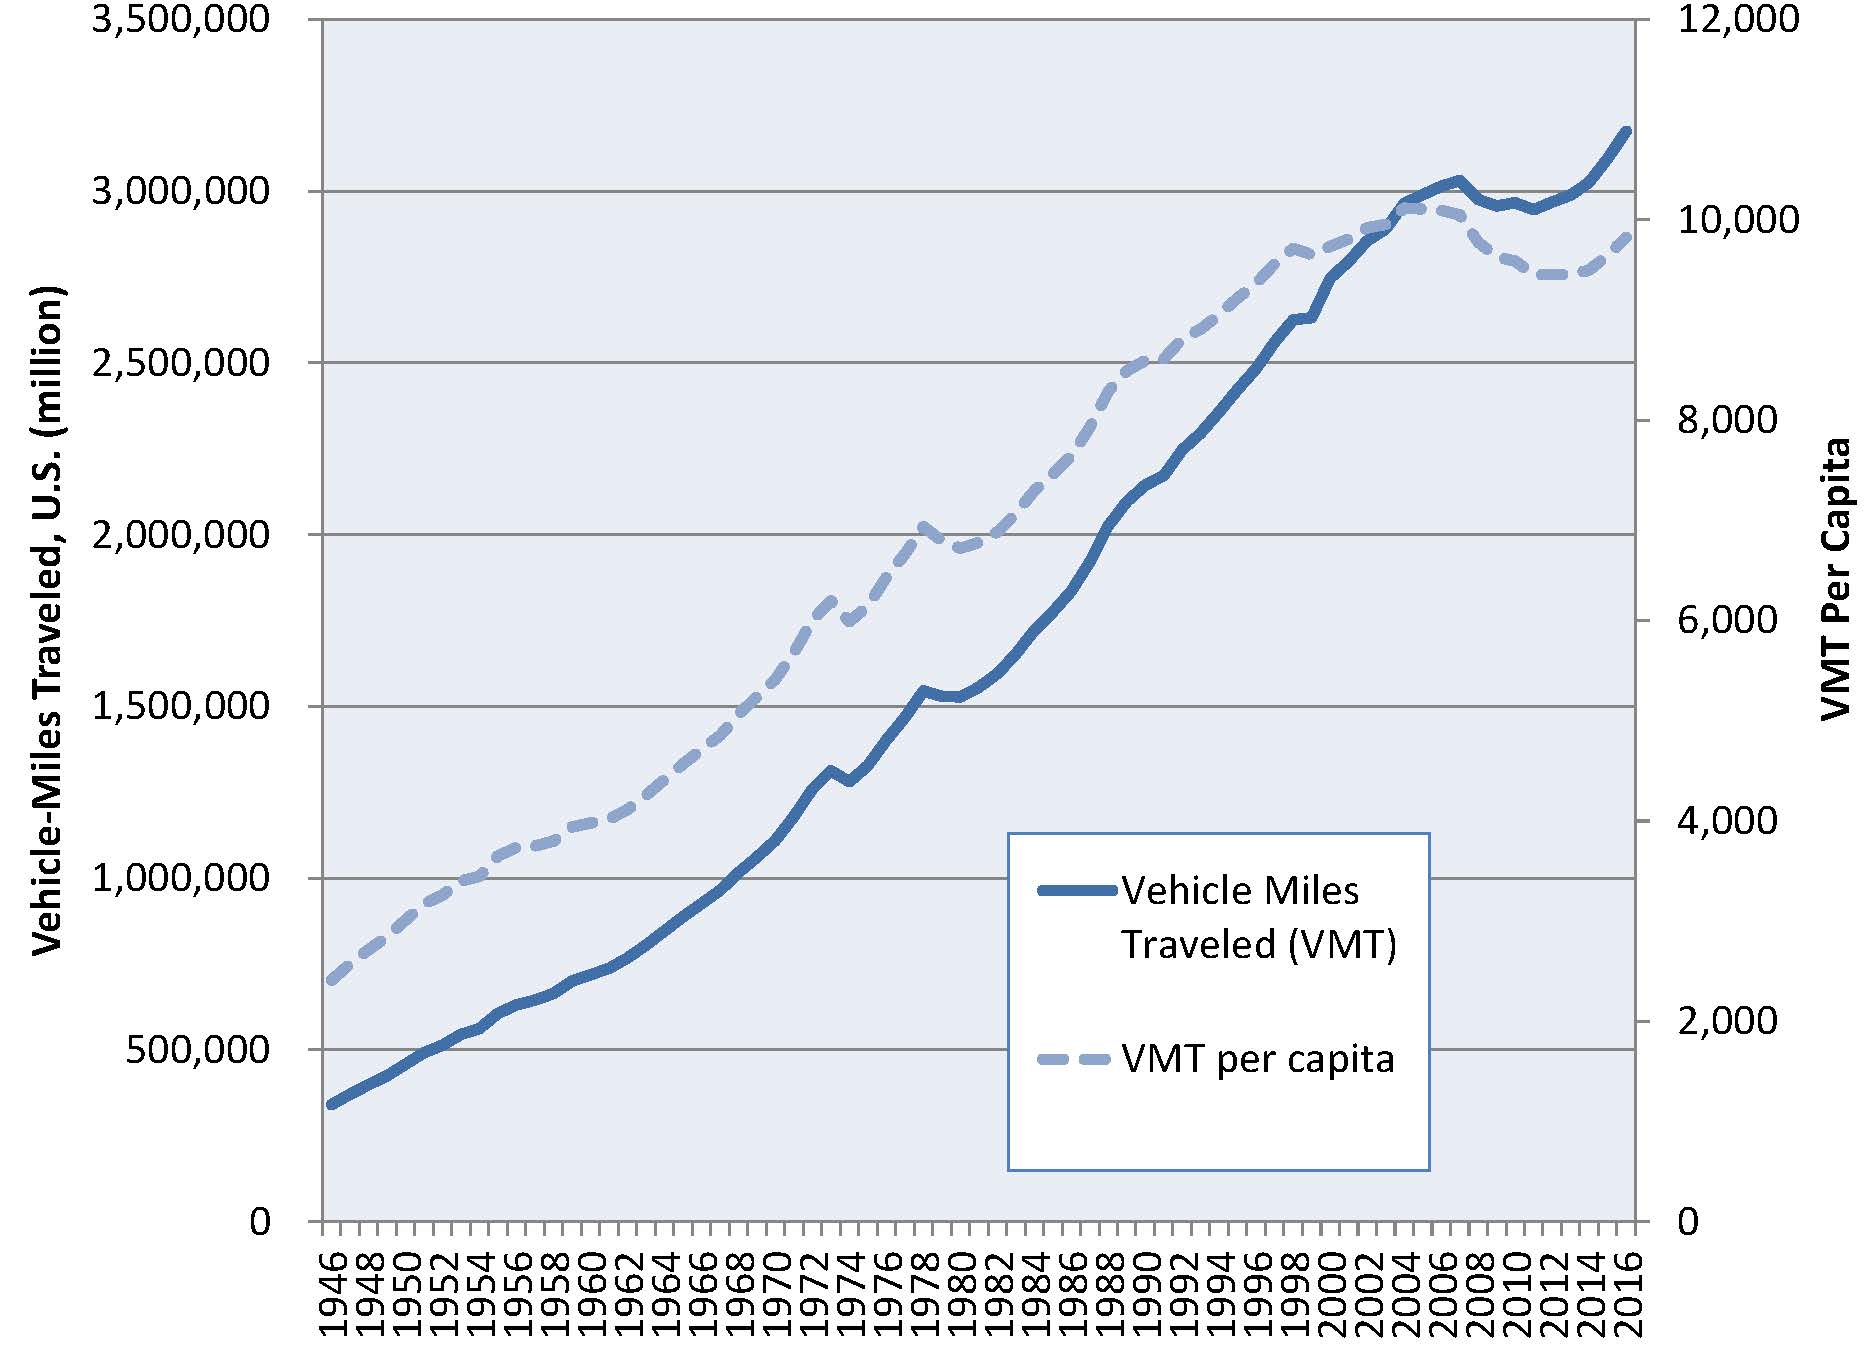
That is a bad thing if you care about global warming, air quality, death and injury on the roads or getting anywhere remotely on time. But will the recent surge in driving be sustained? Beneath the topline data, there are a few fascinating data points that don’t quite provide the answers but do suggest some important questions we might ask next.First, the big picture: Total vehicle-miles traveled (VMT) increased 2.5% in 2016, the biggest increase since 2004. VMT has increased by 7.7% since 2011 and by 4.7% over the previous peak (2007).
On a per-capita basis, VMT increased 1.8% in 2016, the biggest increase in nearly two decades (since 1997). Per-capita VMT has increased by 3.9% since 2011, but still remains 3% below the previous peak (2004).
Today, the average American drives about as much as he or she did in 2002. After roughly six decades of nearly continual increases in per-capita VMT, the fact that Americans drive as much as they did 14 years ago remains historically unusual.
Where things get interesting, however, is with the data on VMT per licensed driver (above), which increased by only 0.9% in 2016. It is up 3.0% since 2011, but remains 4.0% below the previous peak (2004).
As it turns out, the past two years have seen a surge of new licensed drivers – 7.6 million of them, according to the FHWA. Not since 1976-77 has America added as many new drivers in as short a period of time.
Roughly a third of those new drivers are Millennials – the group of currently 16 through 34 year-olds whose travel and housing preferences have been picked apart by many (including us). The 35 to 39 year-old group, whose reduction in driving resembled that of the Millennials, saw a significant uptick in licensing as well.
The biggest gain of any age group during the two years, however, was among 65 to 69-year-olds. Indeed, 55% of the increase in licensed drivers from 2014-2016 was among people over 60. Going back to 2011 (see chart below), the 65 to 74 year-old age group has seen by far the biggest increase in the number of drivers on the roads, as the vastly more numerous Boomers, many of them experiencing good health, have come to replace previous smaller cohorts of seniors – especially older seniors – who were less likely or able to drive.
Indeed, despite the increase in the number of licensed Millennial drivers, the percentage of young adults with driver’s licenses remains below 2011 levels and well below the levels of licensing that prevailed in the early 1990s when my generation – the Gen X’ers – were entering the driving population.
The trajectory of these two demographic “bulges” – the uniquely car-oriented Boomers and the less car-focused Millennials – will continue to shape driving trends for the next decade. Indeed, the data on driver’s licensing suggest that the transportation needs of the Baby Boom generation are likely to become a major issue over the next decade or so.
It is also not too soon to start looking for the emergence of Gen Z – those born after 2000 – who begin to reach driving age this year. As the Millennials enter peak driving age (35 to 54 years old), the smaller Gen Z (the echo of the Gen X’ers) will start charting their own course.
Of course, the question of why there has been a surge of licensed drivers in the last two years, after many years of modest growth, cannot be answered by licensing data alone. Certainly, economic recovery, with the decline in unemployment and recent increase in prime-age workforce participation rate, have something to do with it. As do, I suspect, the extremely loose conditions in the market for auto loans and leases that have made it cheap and easy to obtain cars – including, in many cases, cars that the buyers can’t really afford.
It is not necessarily true, however, that VMT growth needs to follow (or lead) economic growth. In 2016, vehicle-miles traveled per unit of real GDP increased by 1.1%, the first annual increase since the recession year of 2009. However, VMT growth and GDP growth have been decoupling for decades now, and 2016’s unusual combination of low gas prices, easy auto credit & latent demand from the recession means that it could very well be an outlier.
Why does all this matter? On one level, trends in VMT are an indicator of the status of efforts to reduce emissions and congestion. The increase in vehicle travel over the last two years is a worrying sign, and the surge in licensed drivers is an indication of our nation’s continued failure to provide a rich menu of convenient transportation options to Americans.
On another level, though, VMT trends tend to shape conversations about the kinds of investments Americans should prioritize in transportation. And, in that regard, it is important not to assume that the trends of the last two years will necessarily continue unabated.
VMT growth has already slowed in 2017, with an increase (through September) of 1.3%, compared with a 3% increase for the first nine months of 2016. Additionally, conditions in the auto market that fueled a rapid growth in car sales and ownership are beginning to change.
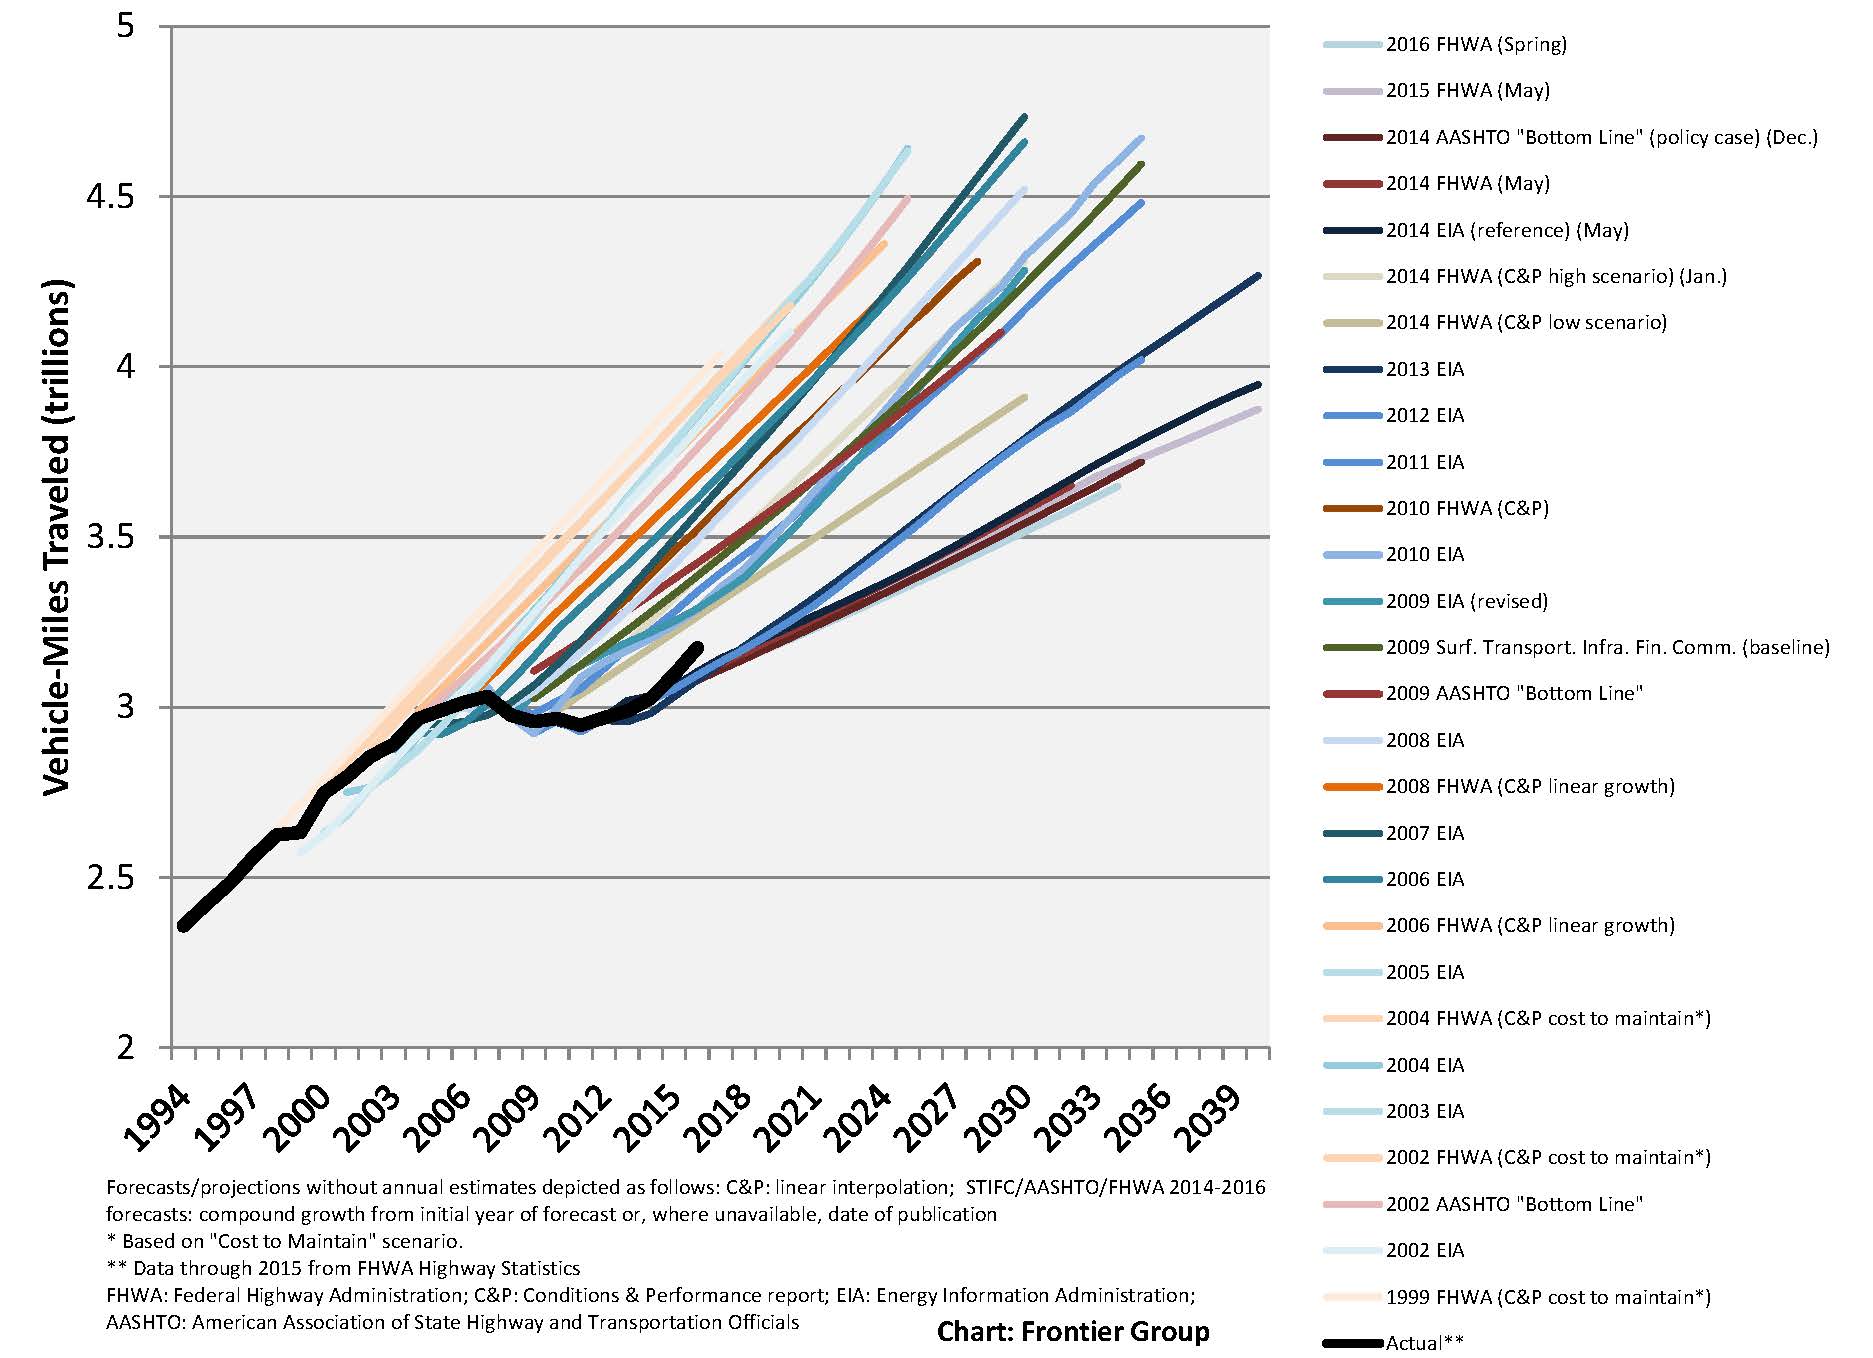
Lastly, it’s important to put the recent increases in VMT in historical context. Despite the recent surge in VMT and historic surge in licensed drivers, Americans are still driving hundreds of billions of miles less than transportation experts and the federal government suspected we would just a decade ago. (See the chart below, which compares actual VMT – black line – with VMT forecasts made over the last two decades.)
The latest data on vehicle travel should lead us to redouble our efforts to expand the number of Americans with convenient, affordable access to travel options other than driving. But when it comes to telling us what is likely to happen next year or the year after that, they need to be taken with a big grain of salt.
Associate Director and Senior Policy Analyst, Frontier Group
Tony Dutzik is associate director and senior policy analyst with Frontier Group. His research and ideas on climate, energy and transportation policy have helped shape public policy debates across the U.S., and have earned coverage in media outlets from the New York Times to National Public Radio. A former journalist, Tony lives and works in Boston.