Wasting Our Waterways

More than 40 years after passage of the Clean Water Act, industrial polluters continue to release more than 206 million pounds of toxic chemicals into America’s waterways each year. Wasting Our Waterways quantifies the amount of industrial pollution released into individual rivers, lakes and other waterways nationwide, names the states and waterways with the greatest releases of chemicals linked to environmental toxicity and human health problems, and issues a call to action to restore the promise of the federal Clean Water Act.

Industrial facilities continue to dump millions of pounds of toxic chemicals into America’s rivers, streams, lakes and ocean waters each year – threatening both the environment and human health. According to the U.S. Environmental Protection Agency (EPA), toxic discharges from industrial facilities are responsible for polluting more than 17,000 miles of rivers and about 210,000 acres of lakes, ponds and estuaries nationwide.

To curb this massive release of toxic chemicals into our nation’s water, we must step up Clean Water Act protections for our waterways and require polluters to reduce their use of toxic chemicals.

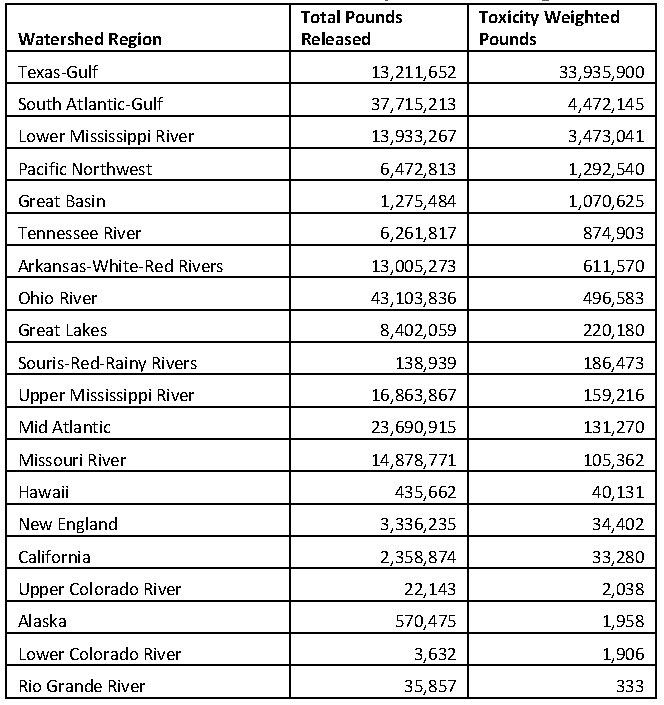
Industrial facilities dumped 206 million pounds of toxic chemicals into American waterways in 2012, according to reports from those facilities to the national Toxics Release Inventory (TRI). (See Table ES-1 and Figure ES-1.)
  • Our nation’s iconic waterways are still threatened by toxic pollution – with polluters discharging chemicals into the following watersheds: Great Lakes (8.39 million pounds), Chesapeake Bay (3.23 million pounds), Upper Mississippi River (16.9 million pounds), and Puget Sound (578,000 pounds), among other national treasures. (See Figure ES-2.)
  • Polluters released toxic chemicals to 850 local watersheds across the country. Indiana led the nation in total volume of toxic releases to waterways, with more than 17 million pounds of discharges from industrial facilities, followed by Texas and Louisiana. The top 10 states for toxic industrial releases to waterways were the same as in 2010. (See Table ES-2.)
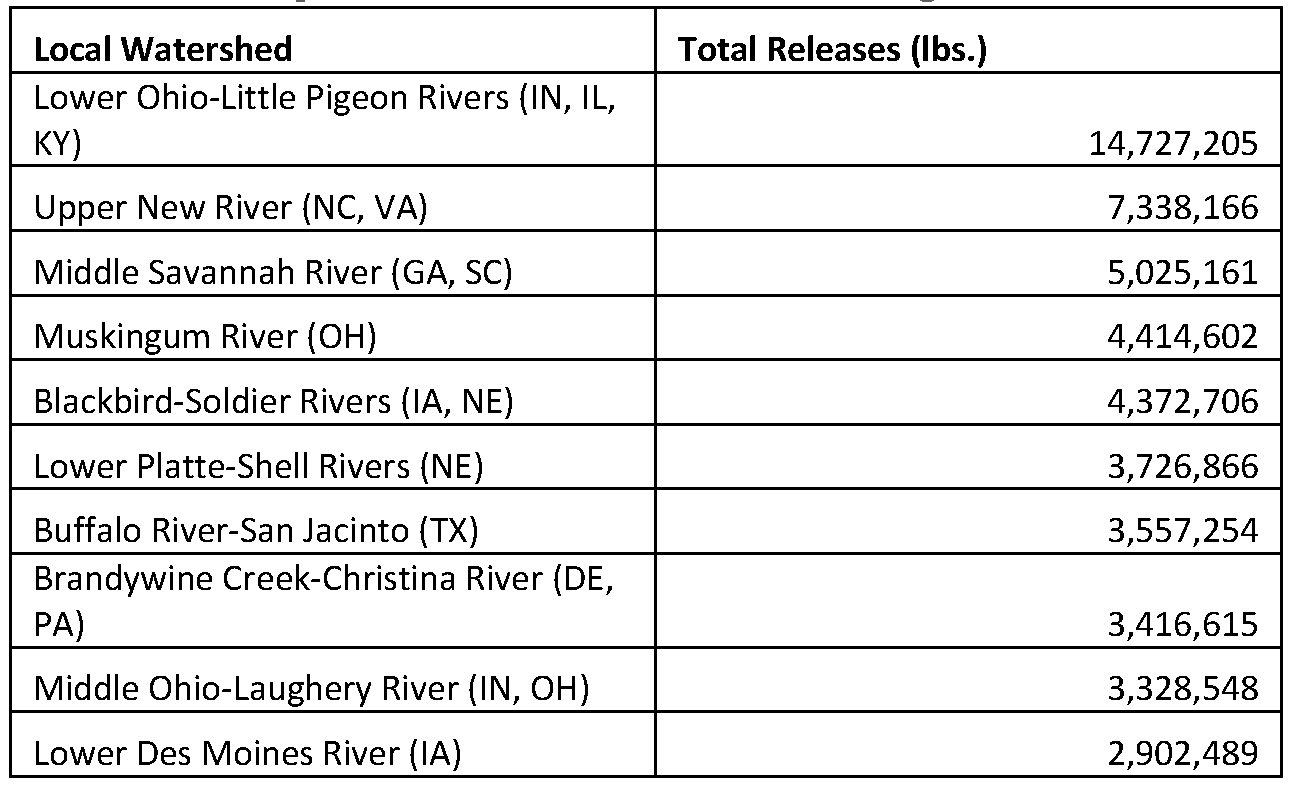
  • Watersheds receiving the highest volumes of toxic pollution were the Lower Ohio River-Little Pigeon River (Indiana, Illinois and Kentucky), the Upper New River (Virginia) and the Middle Savannah River (Georgia and South Carolina). (See Table ES-3.)
Table ES-1. Industrial Toxic Releases by Watershed Region


Several of these watershed regions contain multiple outlets to the ocean. Toxics released in these areas do not all follow the same path to the sea.
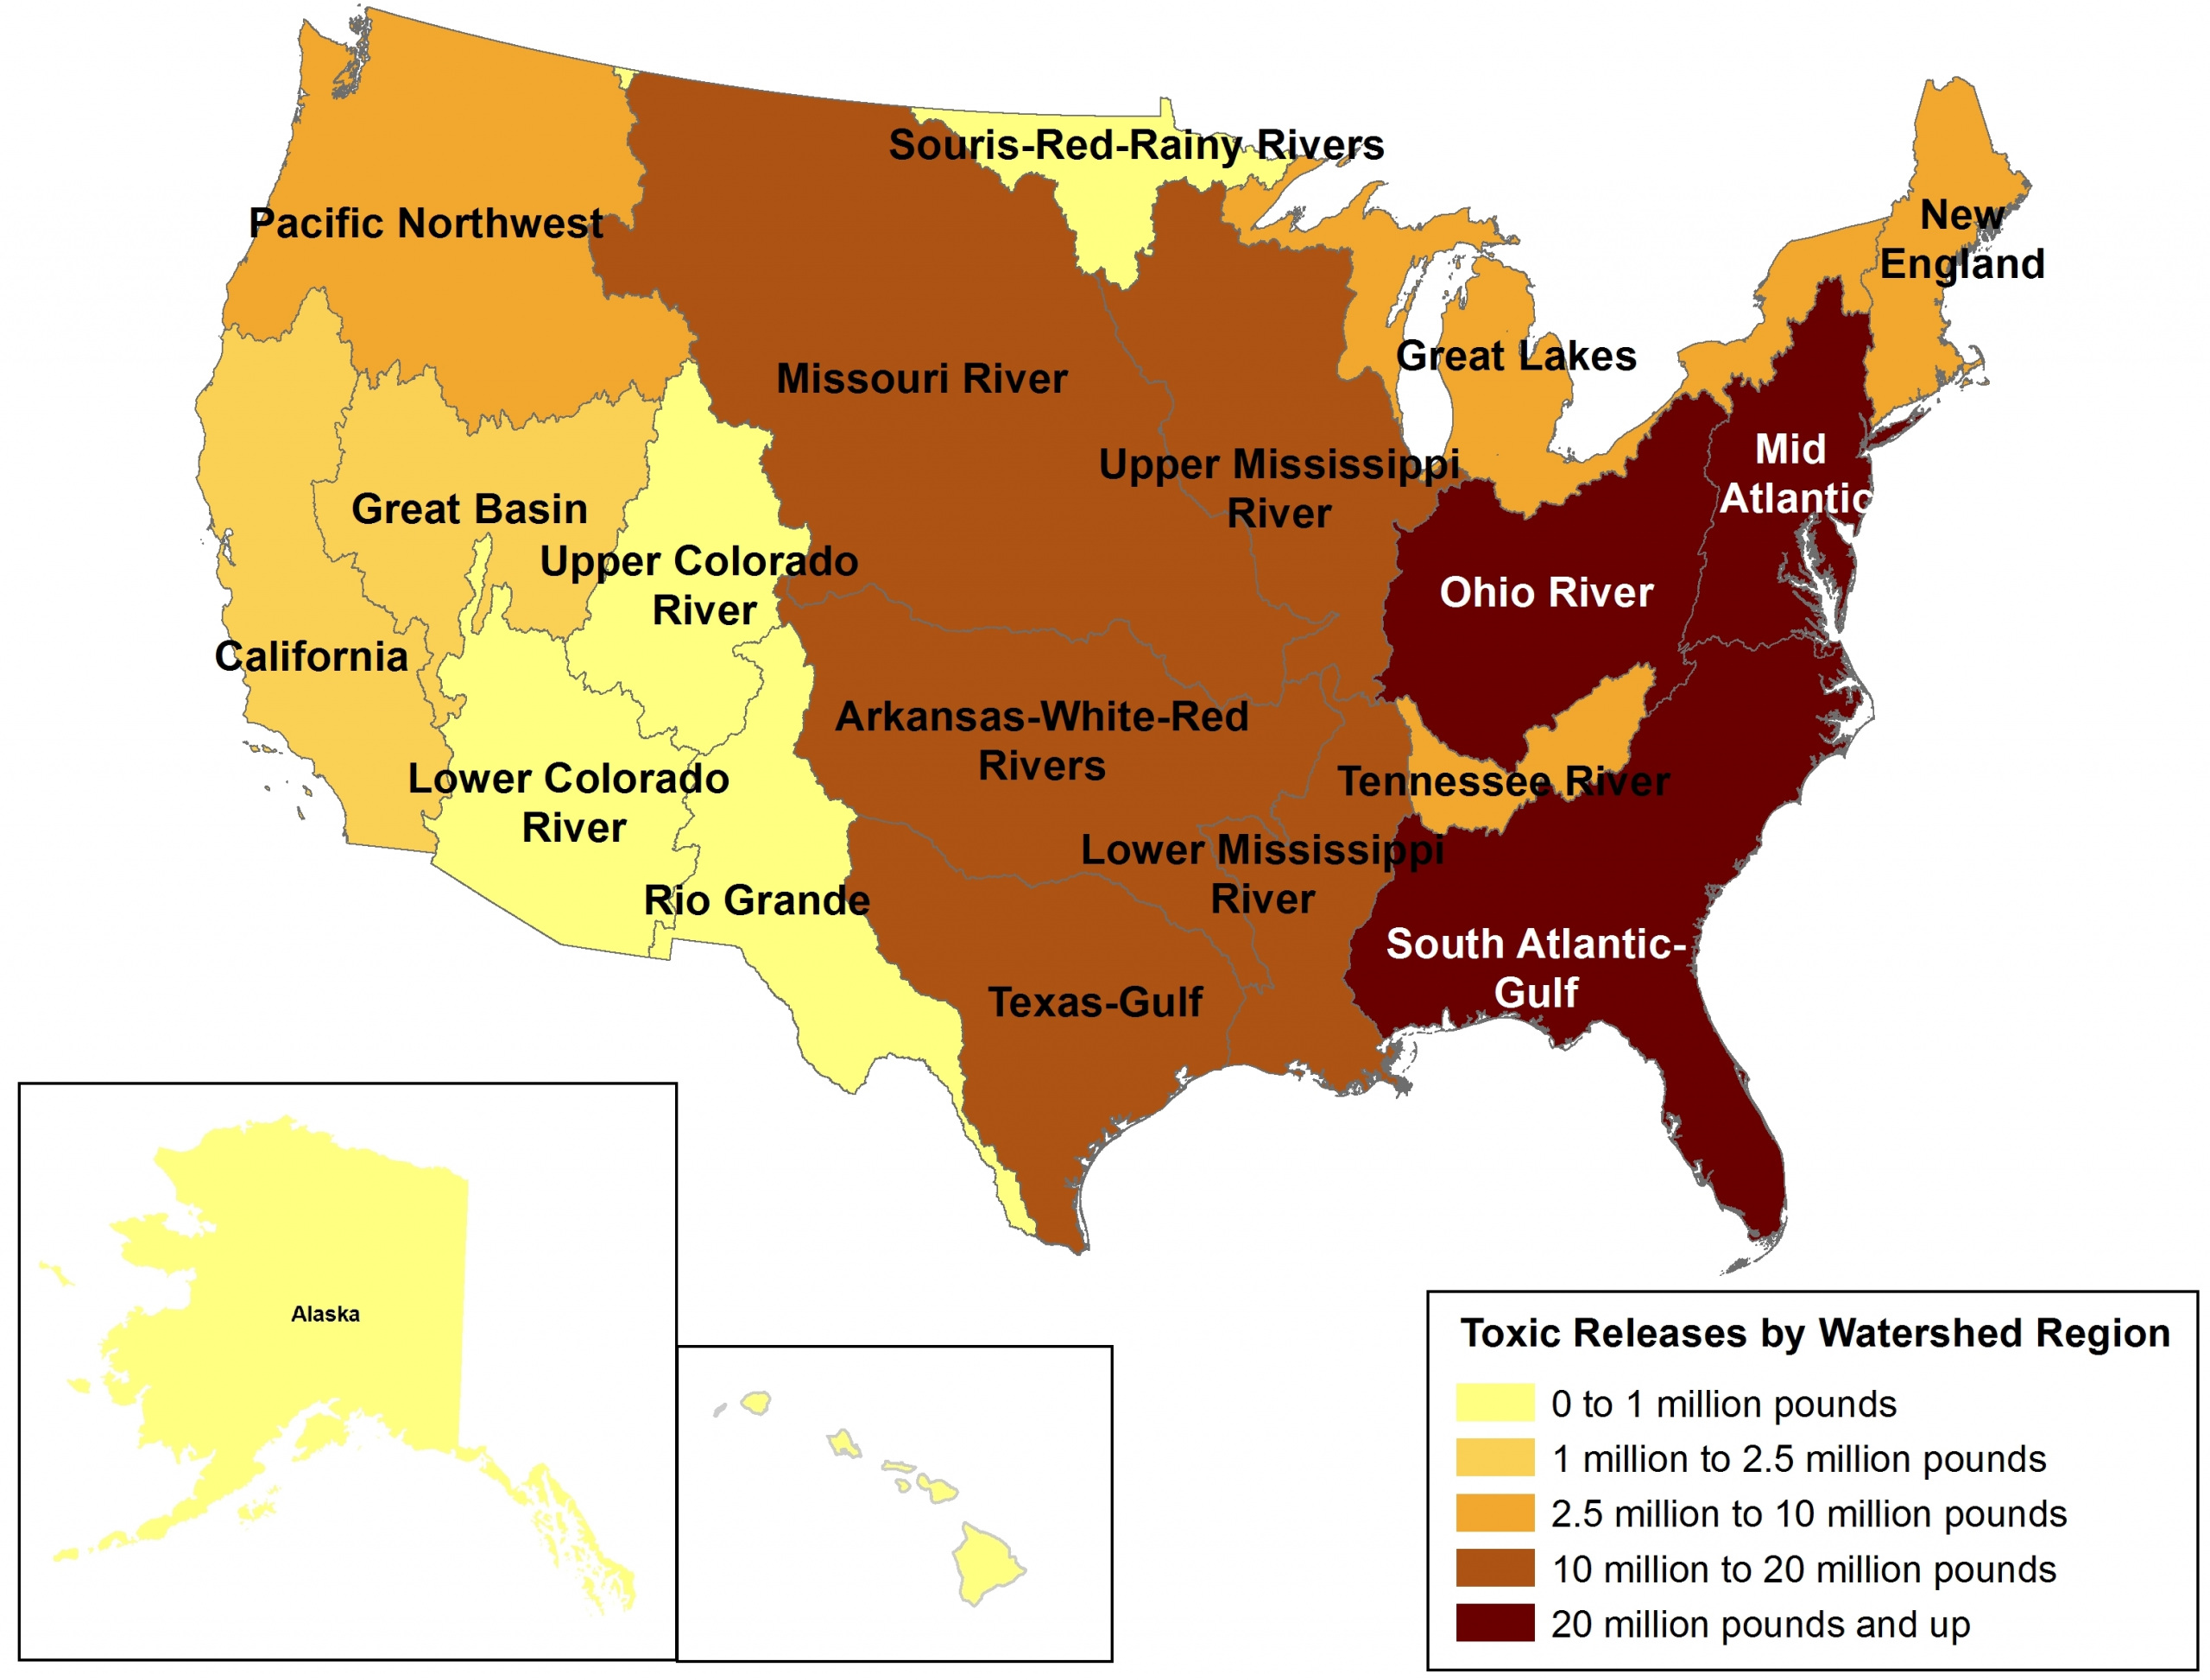
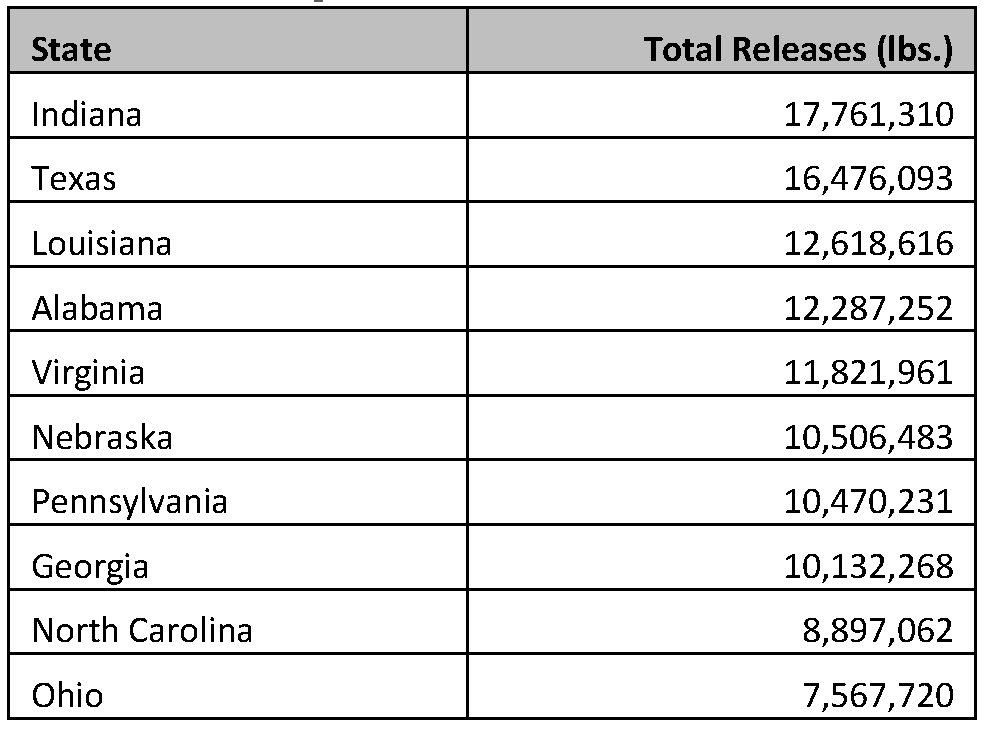
                                                                                                                                         

Figure ES-1. Industrial Discharges of Toxic Chemicals to Waterways by Watershed Region


Table ES-2. Top 10 States for Toxic Releases to Water in 2012


Figure ES-2. Industrial Discharges of Toxic Chemicals to Nationally Iconic Watersheds


Toxic chemicals linked to serious health effects were released in large amounts to America’s waterways in 2012.

  • Cancer: Industrial facilities released more than 1.4 million pounds of chemicals linked to cancer into 688 local watersheds during 2012, including arsenic, benzene and chromium. The North Fork Humboldt River watershed in Nevada received the largest release of carcinogens among local watersheds, followed by the Lake Maurepas watershed in Louisiana.
  • Developmental damage: More than 460,000 pounds of chemicals linked to developmental disorders were released into more than 600 local watersheds. Nevada’s North Fork Humboldt River watershed suffered the most developmental toxicant releases among local watersheds, followed by the Lake Maurepas watershed in Louisiana.
  • Fertility problems: Approximately 4.4 million pounds of fertility-reducing chemicals were released to more than 600 local watersheds. The Lower Chehalis River watershed in northwestern Washington, which flows into a bay surrounded by wildlife refuges, state parks and beaches, received the second-highest volume of reproductive-toxic releases in the nation.
  • Discharges of persistent bioaccumulative toxics (including dioxin and mercury) are also widespread.

Industrial facilities – especially those operated by corporate agribusiness – continue to release high volumes of nitrates into America’s waters.
  • Nitrate compounds – which can cause serious health problems in infants if found in drinking water and which contribute to oxygen-depleted “dead zones” in waterways – were by far the largest releases of toxic chemicals in terms of overall weight.
  • Corporate agribusiness facilities – such as slaughterhouses and poultry plants – were responsible for approximately one-third of all direct discharges of nitrates to waterways. This is in addition to huge volumes of runoff pollution from factory farms and other agribusiness operations.
  • Toxic releases continued in already damaged waterways. For example, Tankersley Creek in northeast Texas has long been the target of state and federal cleanup efforts, but a 30-year-old chicken-processing plant released four times more nitrates into Tankersley Creek in 2012 than it had in 2000.
Table ES-3. Top 10 Local Watersheds Receiving Toxic Releases, Total Pounds.


Toxic chemicals vary in the severity of the threat they post to the environment and human health. When weighted by toxicity of releases, the watersheds receiving the most toxic discharges were the Lower Brazos River (Texas), the Lower Grand River (Louisiana), and the North Fork Humboldt River (Nevada). (See Table ES-4.)
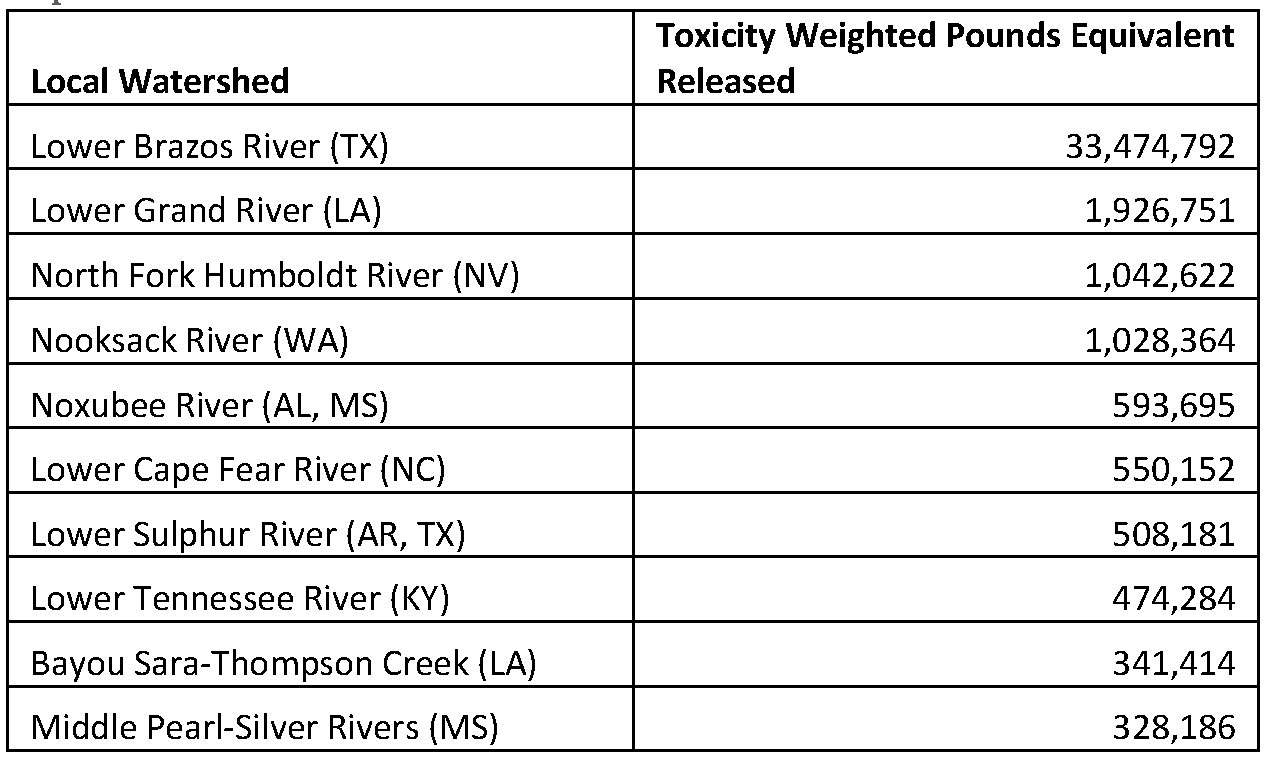
Table ES-4. Top 10 Local Watersheds Receiving Toxic Releases, Toxicity-Weighted Pounds Equivalent


To protect the public and the environment from toxic releases, the United States should prevent pollution by requiring industries to reduce their use of toxic chemicals and restore and strengthen Clean Water Act protections for all of America’s waterways.

The United States should restore Clean Water Act protections to all of America’s waterways and strengthen enforcement and permitting under the Clean Water Act.

  • Specifically, the Obama administration should finalize its proposed rule clarifying that the Clean Water Act applies to headwater streams, intermittent waterways, isolated wetlands and other waterways.

State and federal policies should move industrial polluters away from the use of toxic chemicals, in favor of safer alternatives. Specifically, state and federal officials should:

  • Require the use of safer alternatives to toxic chemicals, where such alternatives already exist.
  • Phase out the worst toxic chemicals.

The data in this report do not cover the entire volume of toxic chemicals released to the environment – just the ones released to surface waterways by industrial facilities that report to the U.S. EPA’s Toxics Release Inventory. To expand understanding of toxic releases, policymakers should:

  • Close loopholes that allow major polluters to avoid reporting their toxic releases. For example, the oil and gas industry should be required to report releases of fracking fluid and drilling waste to the Toxics Release Inventory.
  • Ensure the public is informed about the storage of toxic chemicals, especially in light of the toxic spill that contaminated drinking water for 300,000 people in West Virginia in January 2014.
Topics
Authors

Jeff Inglis

Policy Analyst

Tony Dutzik

Associate Director and Senior Policy Analyst, Frontier Group

Tony Dutzik is associate director and senior policy analyst with Frontier Group. His research and ideas on climate, energy and transportation policy have helped shape public policy debates across the U.S., and have earned coverage in media outlets from the New York Times to National Public Radio. A former journalist, Tony lives and works in Boston.