Solar on Warehouses
Solar power is getting cheaper and more efficient all the time, and America should take advantage of untapped solar energy opportunities, including the billions of square feet of warehouse rooftops across the country.

Solar power is the fastest growing form of energy in the United States, thanks in large part to its low and rapidly dropping price and to supportive public policies in some parts of the country. But the United States has the technical potential to produce 78 times as much electricity as it used in 2020 just with solar photovoltaic (PV) energy. To quickly and sustainably achieve a future of 100% renewable energy, America must take advantage of untapped solar energy opportunities.
Why warehouses have such huge solar potential
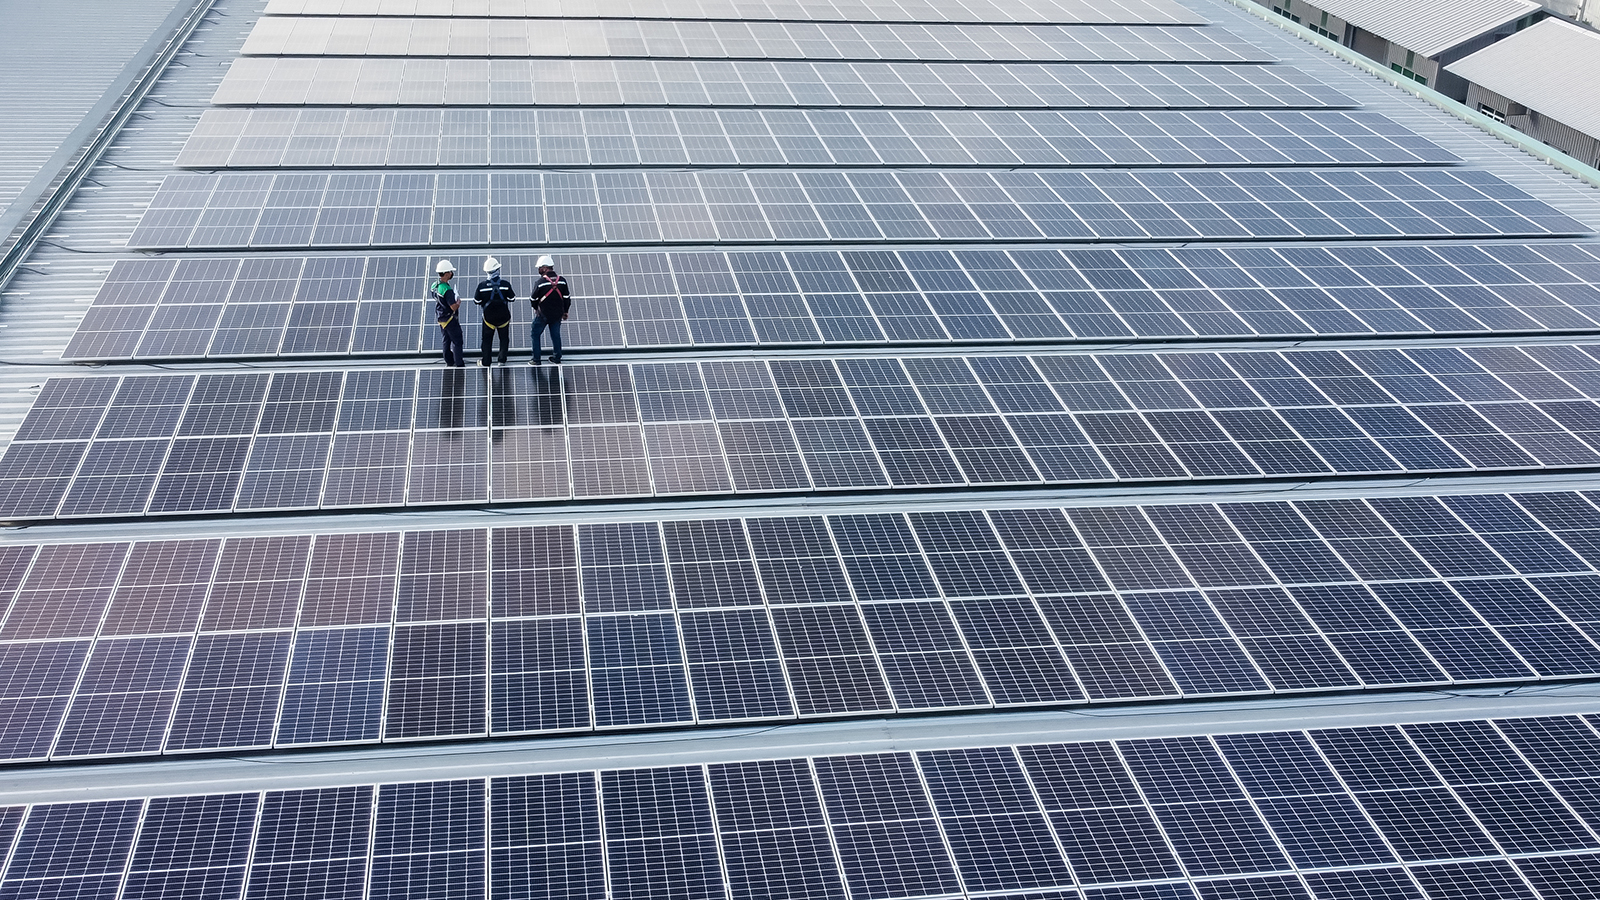
The flat, open, sunny roofs of medium and large warehouses and distribution centers are perfect locations for solar panels. The United States has more than 450,000 such buildings, with almost 16.4 billion cumulative square feet of rooftop space – about twice the area of the entire city of Memphis, Tennessee. And the number of warehouses in the U.S. has been growing fast, especially during the first few years of the COVID-19 pandemic, with more than 626 million square feet of warehouse space under construction in the first half of 2022.
The rooftops of American warehouses built before 2019 have the potential to generate 185.6 terawatt-hours (TWh) of solar electricity each year, enough to power almost 19.4 million average homes. California, Florida, Illinois, Texas and Georgia have the largest warehouse solar generation potential.
Why putting solar panels on warehouse rooftops benefits everyone
Putting solar panels on the nation’s warehouses would be good for businesses, good for electricity customers, good for the grid and good for the environment.
- Generating the full 185.6 TWh of clean solar power potential from America’s warehouses would reduce global warming pollution by more than 112 million metric tons of CO2 equivalent annually – equal to taking over 24 million of today’s gasoline powered passenger vehicles off the road for a year.
- California, Ohio, Illinois, Georgia and Texas have the largest emissions reduction potential.
- On average across the country, warehouses could produce 176% of their annual electricity use by fully building out their rooftop solar potential, allowing them to produce more electricity than they use and provide electricity to their communities.
Producing electricity on rooftops, close to where the electricity will be used, reduces energy losses that happen during electricity transmission and distribution – losses that made up 5.2% of gross electricity generation in 2020. It also reduces the need for new utility-scale generation and transmission infrastructure and the damage to fragile ecosystems those can cause. Solar power also makes the grid more resilient to outages and disruptions.
How many warehouses are in each state and how much solar energy could be produced on those warehouse rooftops?
The map below shows the solar PV technical potential on medium and large warehouse buildings in each state, as well as the reductions in global warming emissions each state would see by building out that technical potential. Hover over or click on a state to see details about its warehouse rooftop solar potential.
Policies businesses and governments should adopt to realize more solar potential
To combat climate change, help their communities, increase resilience and reduce energy expenses, businesses should set ambitious goals to install solar generation capacity on their facilities and invest the time and resources needed to meet those goals. They should, additionally:
- Investigate, catalog and report climate impact and energy use throughout their businesses;
- Set strong, detailed and comprehensive environmental goals; and
- Use their political influence to advocate for positive policy change.
Officials at all levels of government should implement solar-friendly policies that help to accelerate adoption of solar energy by America’s businesses. These include:
- Ensuring that businesses that generate solar electricity are adequately compensated for the benefits they deliver to the environment, public health and consumers through programs like net metering, feed-in tariffs and value-of-solar payments;
- Enabling and enacting financing tools like third-party and Commercial Property Assessed Clean Energy (C-PACE) financing of solar installations to help remove financial barriers to solar adoption;
- Supporting community solar power programs to allow businesses to go solar in partnership with their communities; and
- Streamlining and reducing the costs of solar permitting and interconnection processes to make going solar easier and faster.
Methodology
State-by-state information on building numbers, sizes, and uses came from the National Renewable Energy Laboratory’s (NREL) modeled 2019 City and County Commercial Building Inventories. Building subsets were considered medium or large warehouses if they had 5,000 square feet or more of building area and a Department of Energy (DOE) building prototype (field name “doe_prototype”) of “warehouse.” Records were limited to those for which the “yearbuilt_mean” was before 2019 or blank and in which “bldg_count” was not blank.
Total rooftop area for each building subset was calculated as the total building area for all the buildings in that subset divided by number of building stories per building. Entries that had a blank in the number of stories field were assumed to have one story.
For each building inventory record, average building area was calculated as the total area for the building subset divided by the number of buildings in that subset.
The solar generation potential of warehouses in each state was calculated using NREL’s 2016 report Rooftop Solar Photovoltaic Technical Potential in the United States: A Detailed Assessment – which presents the area of building rooftops suitable for solar deployment and the technical generation potential for rooftop solar on medium and large buildings broken down by state. Alaska and Hawaii are not included in that study, and so are excluded from our analysis except in comparisons to total U.S. energy usage and in calculations of total U.S. warehouse rooftop area. Dividing the solar technical generation potential by the usable rooftop area produced an estimate of the amount of electricity that could be produced per square foot of usable rooftop area in each state. Multiplying this figure by the area of warehouse rooftops in each state and an estimate from the same NREL report of the proportion of medium and large building roofs suitable for hosting solar panels (49% and 66% respectively) resulted in the estimate of warehouse rooftop solar generation technical potential for each state. This technical potential was then adjusted to account for increasing solar panel efficiency (to 19.8% for large non-residential solar installations in 2021 according to Lawrence Berkeley National Laboratory’s 2022 Tracking the Sun report) since the 2016 study was published.
This resulting estimate of warehouse generation potential by state and region formed the basis for other energy equivalents. Those were calculated as follows:
- Warehouse solar generation potential relative to the electricity consumption of the households in the largest city in every state used 2021 population data for each incorporated area in the U.S. from the Census Bureau, and the average number of people per household (2.5) in 2022 from the Census Bureau.
- Share of total electricity sales by state were calculated as the ratio of warehouse rooftop solar generation potential to 2021 electricity retail sales, downloaded from the Energy Information Administration’s (EIA) Electricity Data Browser.
- Equivalent in households was based on average electricity consumption of households (residential utility customers) in each state in 2021, calculated by multiplying average monthly consumption from the EIA by 12.
- Global warming pollution reduction potential was calculated by multiplying warehouse solar generation potential by each state’s 2020 non-baseload output emission rate for electricity generation from the U.S. Environmental Protection Agency’s eGRID Data Explorer.
Warehouse solar generation potential as a share of current warehouse electricity consumption was calculated using state estimates of warehouse electricity consumption, which were based on regional electricity usage from EIA’s 2018 Commercial Building Energy Consumption Survey microdata. Warehouse average electricity use per square foot in each Census region was calculated using the weighted-value fields for annual electricity consumption and square footage multiplied by the final weights for those entries, for those buildings of 5,000 or more square feet of area in the primary building activity (“PBAPLUS”) categories of “distribution/shipping center,” “non-refrigerated warehouse,” “public rental storage units,” and “refrigerated warehouse,” which most closely match the DOE prototypes used to define warehouse buildings. The resulting electricity use per square foot factors were then multiplied by the total square footage for each warehouse inventory entry in the 2019 City and County Commercial Building Inventories in the appropriate region, to calculate warehouse electricity use.
Topics
Authors
Johanna Neumann
Senior Director, Campaign for 100% Renewable Energy, Environment America Research & Policy Center
Johanna directs strategy and staff for Environment America's energy campaigns at the local, state and national level. In her prior positions, she led the campaign to ban smoking in all Maryland workplaces, helped stop the construction of a new nuclear reactor on the shores of the Chesapeake Bay and helped build the support necessary to pass the EmPOWER Maryland Act, which set a goal of reducing the state’s per capita electricity use by 15 percent. She also currently serves on the board of Community Action Works. Johanna lives in Amherst, Massachusetts, with her family, where she enjoys growing dahlias, biking and the occasional game of goaltimate.
Bryn Huxley-Reicher
Former Policy Analyst, Frontier Group
Find Out More

Recording of Rooftop Solar on the Rise webinar

Rooftop solar on the rise

Lawn care goes electric


