Abigail Bradford
Policy Analyst
Cities across America are rapidly adopting solar energy - read on to find out how highly your city ranks. Wherever you live, solar energy is helping to clean the air, lower costs for residents and tackle global warming. Solar energy is at a tipping point. The cost of solar energy is plummeting, poising solar energy for mass-adoption. But attacks by the fossil fuel industry and some utilties are threatening this promise. Cities, states and the federal government need to maintain and enact strong policies to allow solar energy to rise above the horizon.
Note: A more recent version of this report is available.
Solar power is expanding rapidly. The United States now has over 60 gigawatts (GW) of solar photovoltaic (PV) capacity installed – enough to power nearly one in every 11 homes in America. Hundreds of thousands of Americans have invested in solar energy and millions more are ready to join them.
America’s major cities have played a key role in the clean energy revolution and stand to reap tremendous benefits from solar energy. As population centers, they are major sources of electricity demand and, with millions of rooftops suitable for solar panels, they have the potential to be major sources of clean energy production as well.
Our sixth annual survey of solar energy in America’s biggest cities finds that the amount of solar power installed in just 20 U.S. cities exceeds the amount installed in the entire United States at the end of 2010. Of the 57 cities surveyed in all six editions of this report, 79 percent more than doubled their total installed solar PV capacity between 2013 and 2018.
To continue America’s progress toward renewable energy, cities, states and the federal government should adopt strong policies to make it easy for homeowners, businesses and utilities to “go solar.”
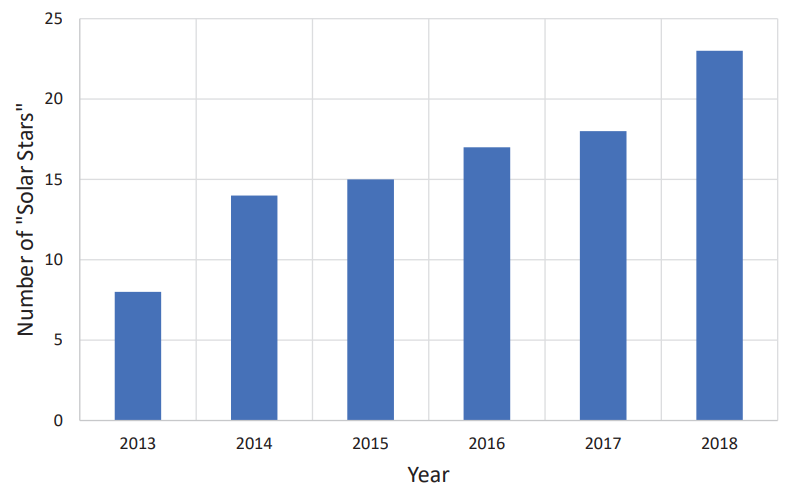
The cities with the most solar PV installed per resident are the “Solar Stars” – cities with 50 or more watts of solar PV capacity installed per capita. In 2013, only eight of the cities surveyed for this report had enough solar PV per capita to be ranked as “Solar Stars,” but now 23 cities have earned the title.
Figure ES-1. The Number of “Solar Stars” (Cities with >50W of Solar PV per Capita) in Each Edition of Shining Cities
Honolulu leads the United States for solar power per person among cities surveyed, followed by San Diego, San Jose and Burlington, Vermont. All of the “Solar Stars” have experienced dramatic growth in solar energy and are setting the pace nationally for solar energy development.
Figure ES-2. Major U.S. Cities by Installed Solar PV Capacity Per Capita, End of 2018 (Watts per Person)
Table ES-1. The “Solar Stars” (Cities with 50 or More Watts of Solar PV per Person, End of 2018)
| Per Capita Rank | City | State | Per Capita Solar PV Installed (Watts-DC/person)ǂ | Change in Per Capita Rank 2017 to 2018 | Total Solar PV Installed (MW-DC) | Total Solar PV Rank |
|---|---|---|---|---|---|---|
| 1 | Honolulu | HI | 646.4 | 0 | 226.5 | 4 |
| 2 | San Diego | CA | 247.5 | 0 | 351.4 | 2 |
| 3 | San Jose | CA | 194.9 | 0 | 201.7 | 5 |
| 4 | Burlington | VT | 187.3 | +1 | 7.9 | 37 |
| 5 | Las Vegas | NV | 162.2 | +1 | 104.1 | 9 |
| 6 | Phoenix | AZ | 145.3 | +1 | 236.2 | 3 |
| 7 | Indianapolis | IN | 143.5 | -3 | 123.8 | 8 |
| 8 | Riverside | CA | 138.3 | +1 | 45.3 | 16 |
| 9 | Denver | CO | 129.6 | -1 | 91.4 | 10 |
| 10 | Albuquerque | NM | 128.9 | +2 | 72.0 | 11 |
| 11 | Salt Lake City | UT | 126.9 | -1 | 25.5 | 21 |
| 12 | San Antonio | TX | 123.6 | -1 | 186.9 | 7 |
| 13 | New Orleans | LA | 107.3 | 0 | 42.2 | 18 |
| 14 | Los Angeles | CA | 105.0 | +1 | 419.9 | 1 |
| 15 | Washington | DC | 91.7 | +2 | 63.6 | 12 |
| 16 | Newark | NJ | 88.6 | 0 | 25.3 | 22 |
| 17 | Sacramento* | CA | 84.4 | -3 | 42.3 | 17 |
| 18 | Charleston | SC | 75.5 | N/A | 10.2 | 34 |
| 19 | Jacksonville | FL | 62.1 | +2 | 55.4 | 13 |
| 20 | San Francisco | CA | 57.8 | -2 | 51.1 | 14 |
| 21 | Boston | MA | 54.6 | -2 | 37.4 | 19 |
| 22 | Austin* | TX | 53.2 | +1 | 50.6 | 15 |
| 23 | Hartford | CT | 50.1 | +4 | 6.2 | 42 |
ǂ Throughout the report, includes all solar PV capacity (rooftop and utility-scale solar installations) within the city limits of each city. Does not include solar power installed in the extraterritorial jurisdictions of cities, even those installed by or under contract to municipal utilities. See Methodology for an explanation of how these rankings were calculated. See Appendix B for city-specific sources of data.
* Due to an improvement in methodology or data sourcing for this city, total and per capita solar PV capacity reported in this table are not directly comparable with estimates for this city in previous editions of this report. See Appendix B for details on specific cities.
One-third of the 57 cities surveyed in all six editions of this report more than quadrupled their installed solar PV capacity from 2013 to 2018.
Los Angeles leads the nation in total installed solar PV capacity among the 69 cities surveyed in this report, as it did from 2013 to 2015 and in 2017, after briefly being topped by San Diego in 2016. Since 2016, Los Angeles has added over 150 MW of solar capacity. (See Table ES-2.)
Figure ES-3. Major U.S. Cities by Total Installed Solar PV Capacity, End of 2018 (MW)
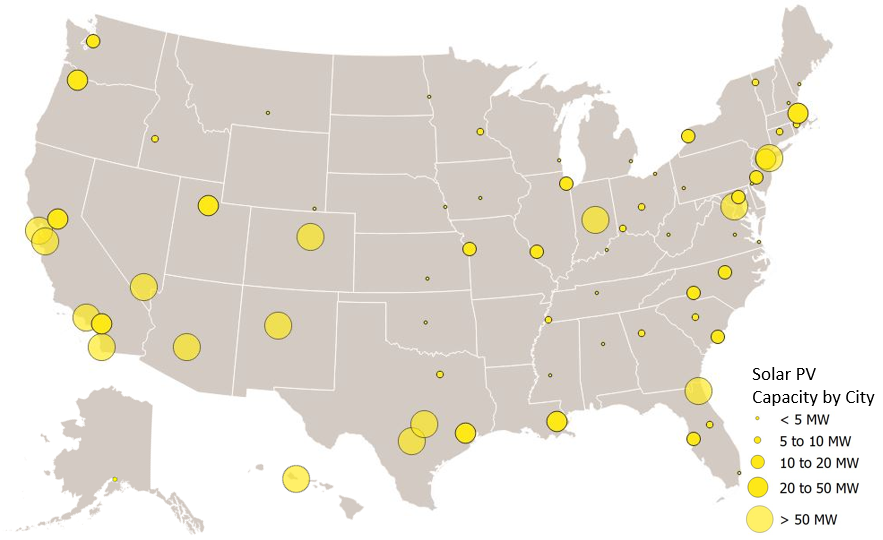
Table ES-2. Top 20 Shining Cities by Total Installed Solar PV Capacity, End of 2018
| Total Solar PV Rank | City | State | Total Solar PV Installed (MW-DC) | Rooftop Solar PV Potential on Small Buildings (MW)ǂ | Per Capita Rank | Per Capita Solar PV Installed (Watts-DC/person) |
|---|---|---|---|---|---|---|
| 1 | Los Angeles | CA | 419.9 | 5,444 | 14 | 105.0 |
| 2 | San Diego | CA | 351.4 | 2,219 | 2 | 247.5 |
| 3 | Phoenix | AZ | 236.2 | 2,981 | 6 | 145.3 |
| 4 | Honolulu | HI | 226.5 | N/A | 1 | 646.4 |
| 5 | San Jose | CA | 201.7 | 1,639 | 3 | 194.9 |
| 6 | New York | NY | 200.0 | 1,277 | 36 | 23.2 |
| 7 | San Antonio | TX | 186.9 | 3,721 | 12 | 123.6 |
| 8 | Indianapolis | IN | 123.8 | N/A | 7 | 143.5 |
| 9 | Las Vegas | NV | 104.1 | 946 | 5 | 162.2 |
| 10 | Denver | CO | 91.4 | 677 | 9 | 129.6 |
| 11 | Albuquerque | NM | 72.0 | 1,252 | 10 | 128.9 |
| 12 | Washington | DC | 63.6 | 344 | 15 | 91.7 |
| 13 | Jacksonville | FL | 55.4 | 1,715 | 19 | 62.1 |
| 14 | San Francisco | CA | 51.1 | 672 | 20 | 57.8 |
| 15 | Austin* | TX | 50.6 | 1,443 | 22 | 53.2 |
| 16 | Riverside | CA | 45.3 | 612 | 8 | 138.3 |
| 17 | Sacramento* | CA | 42.3 | 777 | 17 | 84.4 |
| 18 | New Orleans | LA | 42.2 | 1,277 | 13 | 107.3 |
| 19 | Boston | MA | 37.4 | 341 | 21 | 54.6 |
| 20 | Portland | OR | 31.2 | 1,397 | 24 | 48.2 |
ǂ Reflects the maximum technical solar PV capacity that could be installed on appropriate small building rooftops in each city. These figures were calculated by the U.S. Department of Energy (DOE): U.S. DOE, Energy Efficiency & Renewable Energy State & Local Energy Data, available at apps1.eere.energy.gov/sled/#. Data were unavailable for cities with “N/A” listed.
* Due to an improvement in methodology or data source for this city, total and per capita solar PV capacity reported in this table are not directly comparable with estimates for this city in previous editions of this report. See Appendix B for details on specific cities.
Leading solar cities can be found in every region of the country. Leaders in per capita solar capacity by census region include Honolulu in the Pacific region, Las Vegas in the Mountain region, Indianapolis in the North Central region, San Antonio in the South Central region, Washington, D.C., in the South Atlantic region and Burlington, Vermont, in the Northeast region.
Many smaller cities and towns are also going big on solar energy.
Fossil fuel interests and some utilities are working to slow the growth of distributed solar energy. Over the past few years, many states have considered or passed cuts to net metering – the critical practice of crediting solar energy customers for the excess energy they supply to the grid. Additionally, some states and utilities are now targeting solar customers with special fees, charges and rate designs in order to reduce the appeal and financial promise of installing solar panels. These changes, such as imposing demand charges and other electric bill fees only on solar customers specifically, could cause solar panel owners to pay as much for electricity as other customers, even though they consume less electricity from the grid.
U.S. cities have only begun to tap their solar energy potential. Some of the cities in this report could generate hundreds of times more solar power than they do today. A National Renewable Energy Laboratory (NREL) study estimated that small building rooftops alone are technically capable of hosting enough solar energy to cover the annual electricity needs of more than 121 million American homes – about as many as exist in the U.S. Cities can go even farther by encouraging solar installations on large buildings and stand-alone utility-scale installations.
To take advantage of the nation’s vast solar potential and move America toward an economy powered by 100 percent renewable energy, city, state and federal governments should adopt a series of strong pro-solar policies.
Policy Analyst
Policy Associate