Jamie Friedman
Policy Associate
Industrial facilities across the country emit toxic air pollution that can affect the health of nearby residents. Here's a guide on how to find out if your community is at risk, using the EPA's Toxic Release Inventory (TRI) website.
Pittsburgh has been struggling with air pollution for decades. According to the American Lung Association, the Pittsburgh metropolitan area ranks ninth in year-round particle pollution, and the county scored an “F” on their air quality scorecard.
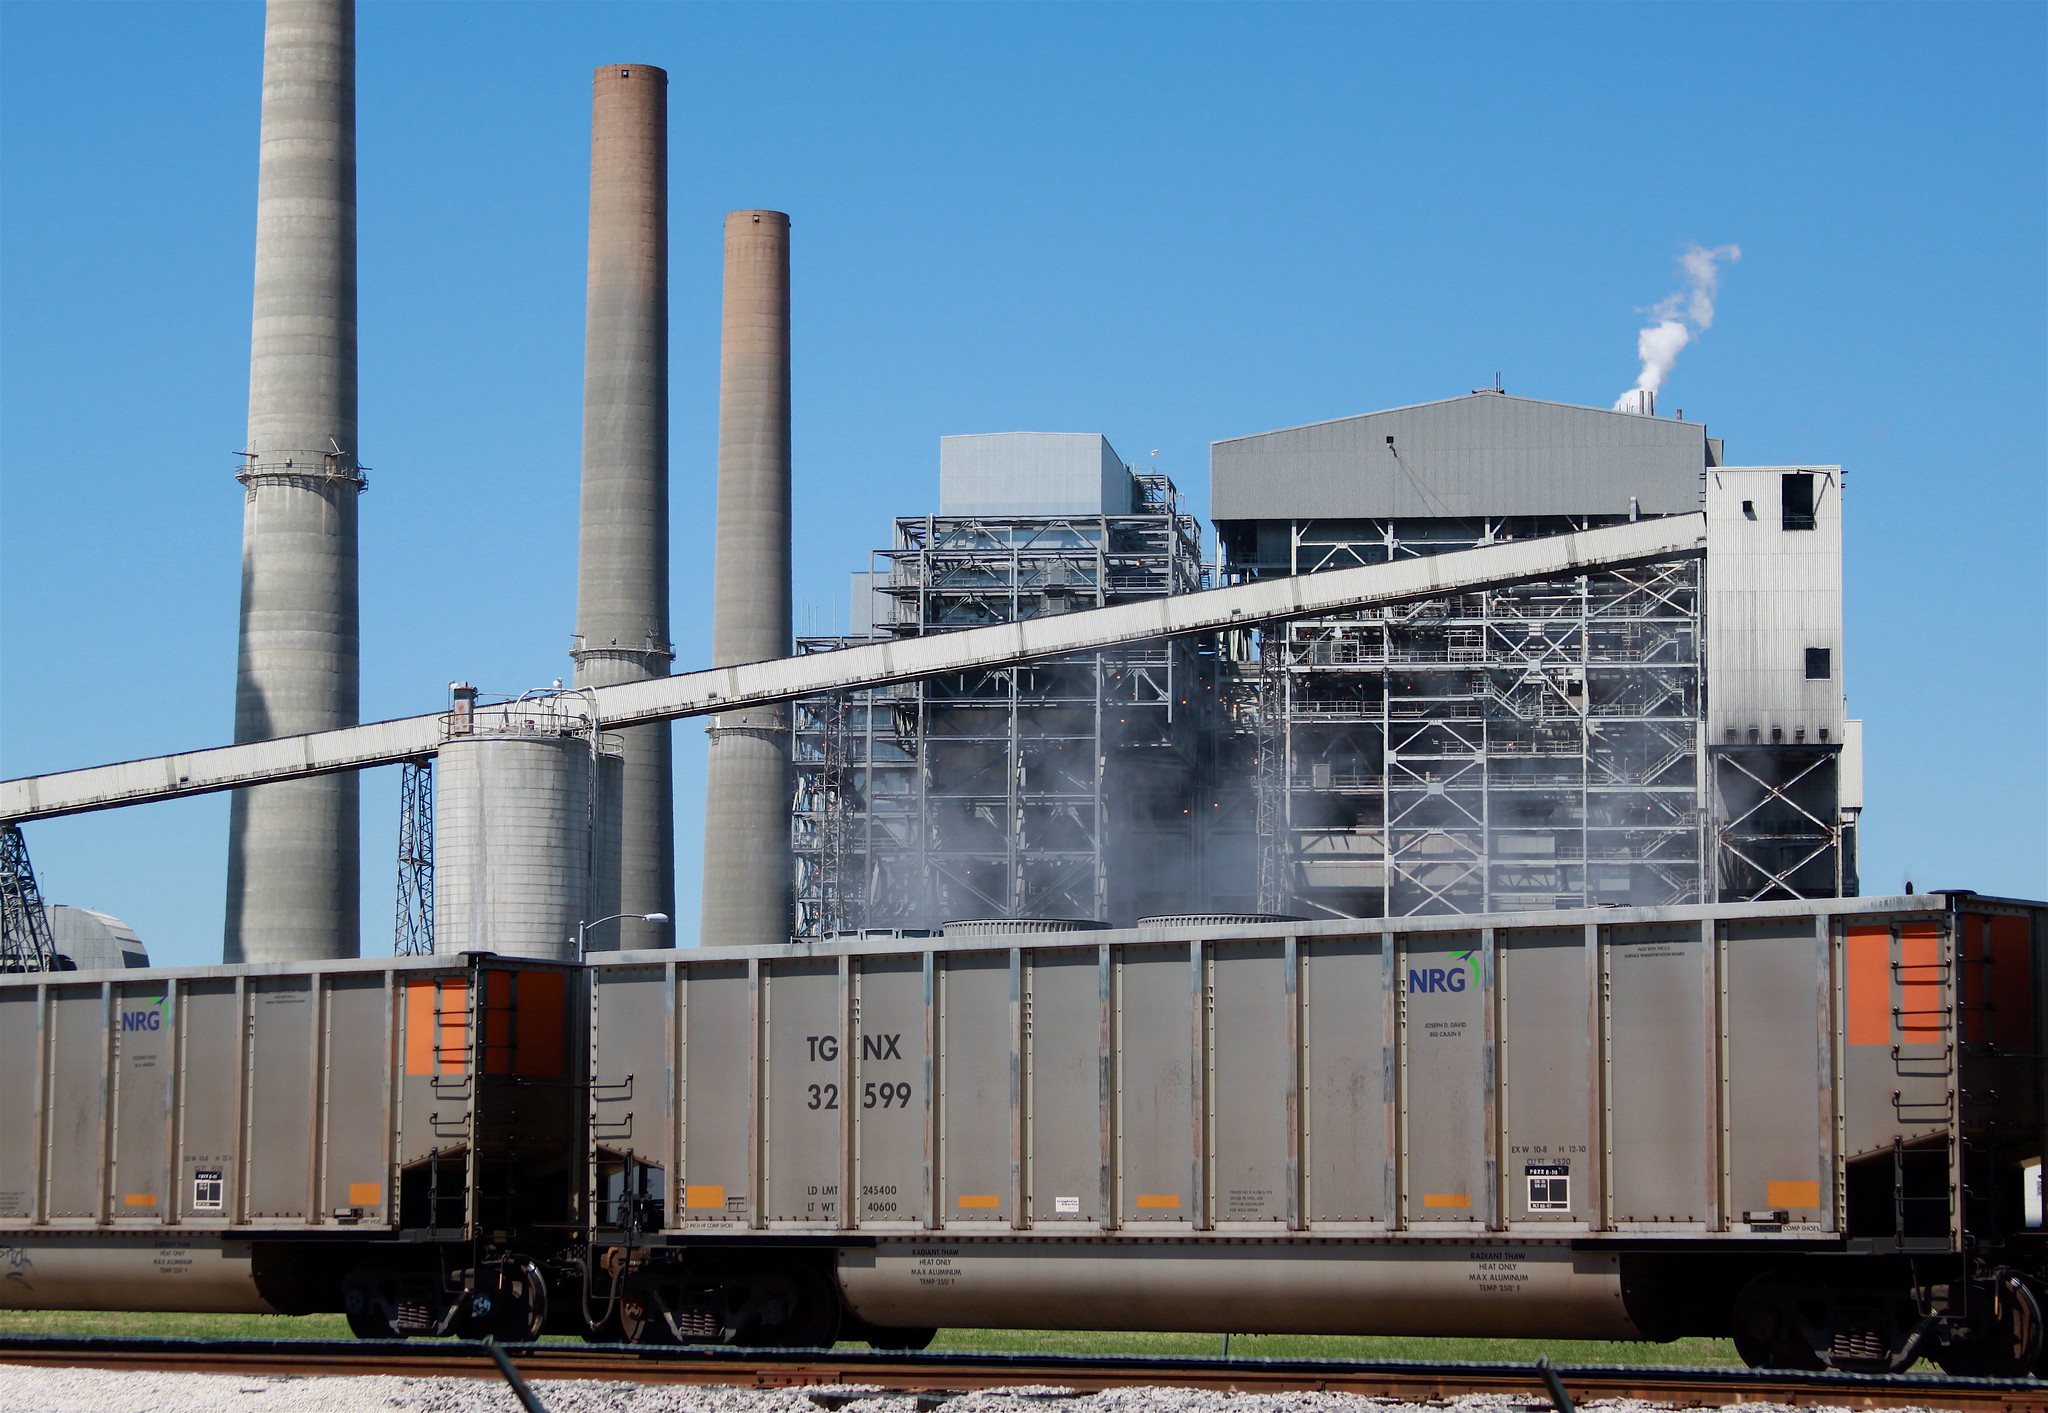
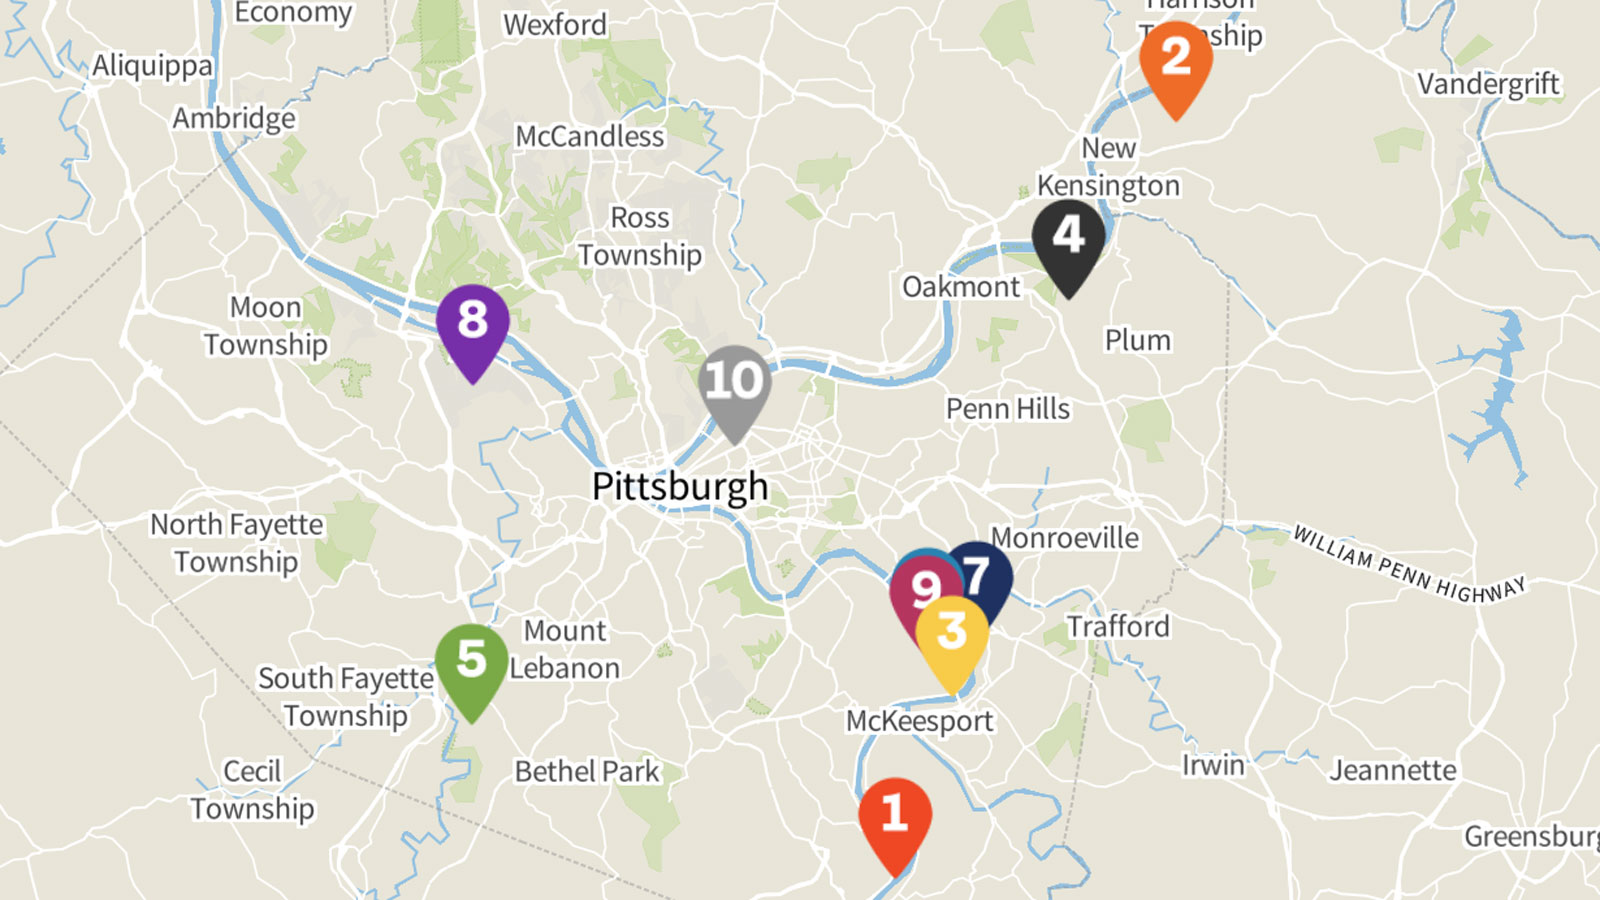
A big part of the problem is toxic emissions from industrial facilities. Our new update to PennEnvironment’s Toxic 10 report looks at the 10 industrial facilities in Allegheny County that emit the most-toxic air pollution, and the resulting health effects of those toxic chemicals.
My work on the project got me thinking: If industrial polluters in Pittsburgh are releasing these toxic substances to the air, where else might similar threats exist? Am I living near a source of toxic air pollution right now without even knowing it?
Fortunately, there is a way for citizens to find the answer — and it is easier than ever. In this post, I’m going to show you how to use tools provided by the EPA to learn about the toxic pollutants from industrial facilities in your city.
In creating the Toxic 10 report, we did a deep dive into the EPA’s Toxic Release Inventory (TRI) data, and used its EasyRSEI dashboard in our data analysis, all of which took quite a bit of time and effort. But luckily, the EPA now has a tool on its website that is even easier to use than EasyRSEI.
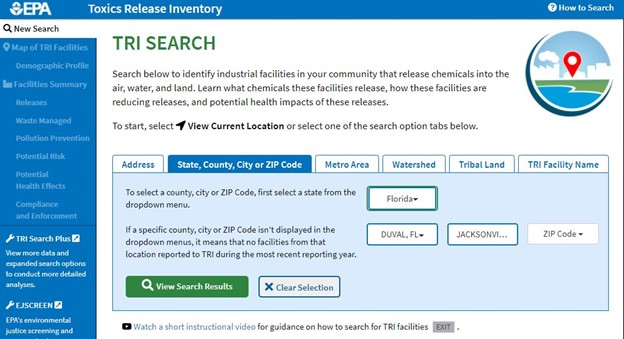
Start by scrolling to the bottom of the page, and under “New Search” put in your address or the city that you want to look at. I chose Jacksonville, Florida.
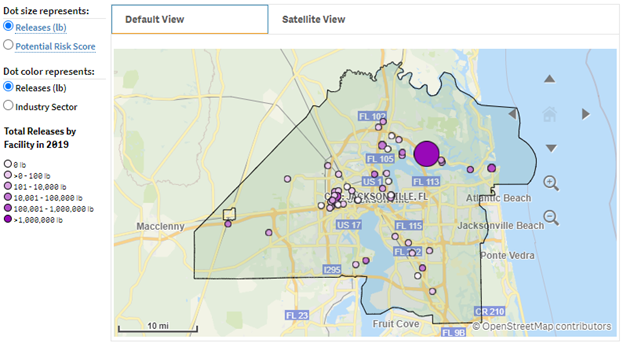
When you click “View Search Results” you’ll be brought to a map of the industrial facilities in your area that report to TRI.1
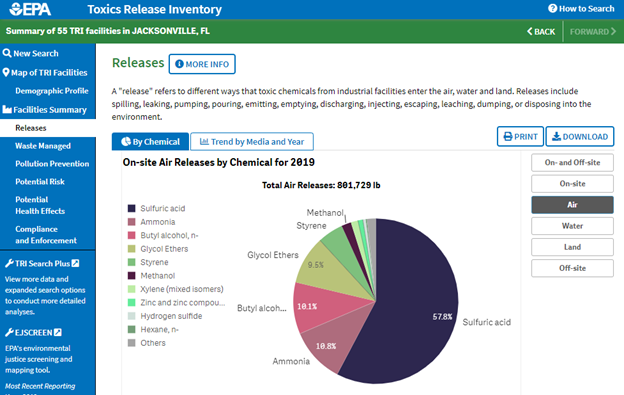
Select “Releases” on the left side of the screen to see how air, water, or land releases break down by chemical. I’m most interested in air releases, so I selected “Air” on the right side of the screen. In my area, it looks like there are a lot of sulfuric acid emissions, and I’m curious to know which industrial facilities are responsible, and what the resulting health effects might be.
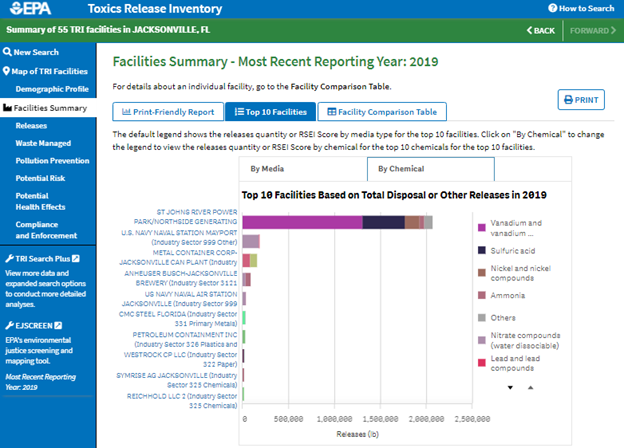
By selecting “Facilities Summary” on the left side, and navigating to the tab that says “Top 10 Facilities,” I can see that St. John’s River Power Plant/Northside Generating had the highest volume of toxic releases in 2019, including most of the sulfuric acid emissions in my area.
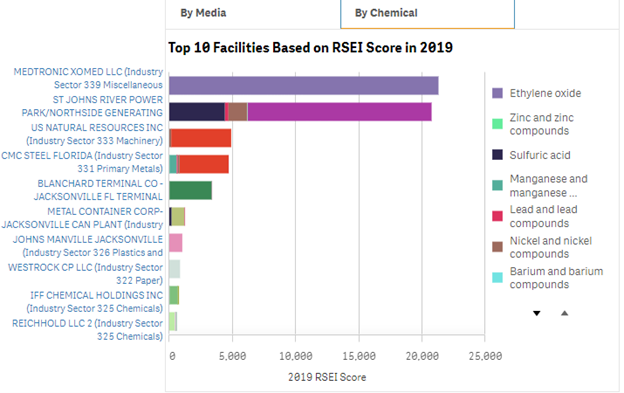
But not every chemical is equally toxic. To understand how dangerous toxic air pollution really is, you need a way to compare the risk posed by various types of chemicals. The EPA makes this easy by calculating each facility’s Risk-Screening Environmental Indicators (RSEI) Score, which accounts for the pounds of the chemical released, how toxic the chemical is, and how many people are exposed to it. You can see the facility’s RSEI Score by scrolling down to the appropriate table. As it turns out, when you take toxicity and population into consideration, a different facility, Medtronic Xomed LLC, ranks highest due to its ethylene oxide emissions.
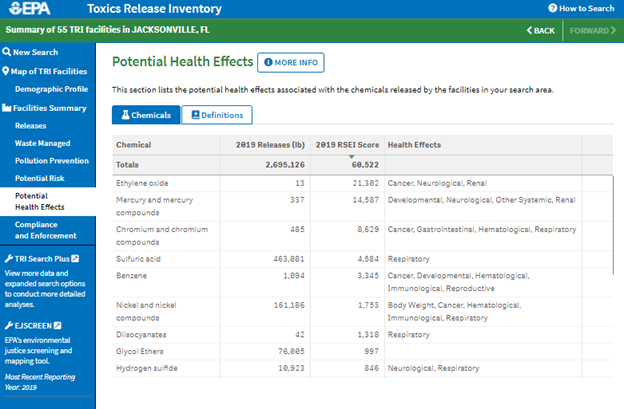
But what I’m most concerned about is the health effects from this pollution. By selecting “Potential Health Effects” on the left side of the screen, I can see a table of each chemical, the facility’s total releases in pounds, its RSEI Score, and the potential health effects of the pollution.
The ethylene oxide emissions that appear to be mainly from Medtronic Xomed LLC are potentially cancer-causing, and could have neurological effects on me and my neighbors. To get more detailed information on any of these chemicals’ health effects, you can look at the CDC’s Toxic Substances List.
Jacksonville may not be among the cities in the country with the worst air pollution, but no level of dirty air is acceptable. Once residents understand the sources of toxic air pollution in their neighborhoods, they can engage more effectively in efforts to stop the pollution in the first place. Just such a thing has been happening in the Pittsburgh area, where growing awareness of pollution from dirty industrial facilities has fueled activism to clean them up and has led some facilities to significantly reduce their emissions.
Tools such as those provided by the EPA — and “right to know” programs like the Toxics Release Inventory — give every American insight into the pollution threats in their community. If you find out the scary truth about air pollution in your city, consider these suggestions from the American Lung Association for how to take action. Together, we can reduce or eliminate toxic threats from industrial facilities not just in Pittsburgh, but everywhere.
Policy Associate