Adrian Pforzheimer
Policy Analyst
What does the solar revolution look like in America's cities? Our seventh annual survey of solar energy in America’s biggest cities finds that solar energy is on the rise, and bringing big benefits -- and yet cities have only begun to tap their solar energy potential.

Solar power is expanding rapidly. The United States now has 77.7 gigawatts (GW) of solar photovoltaic (PV) capacity installed – more than enough to power one in every 10 homes in America. Hundreds of thousands of Americans have invested in solar energy and millions more are ready to join them.
America’s major cities have played a key role in the clean energy revolution and stand to reap tremendous benefits from solar energy. As population centers, they are major sources of electricity demand and, with millions of rooftops suitable for solar panels, they have the potential to be major sources of clean energy production as well.
Our seventh annual survey of solar energy in America’s biggest cities finds that the amount of solar power installed in just seven U.S. cities exceeds the amount installed in the entire United States at the end of 2010. Of the 57 cities surveyed in all seven editions of this report, almost 90 percent more than doubled their total installed solar PV capacity between 2013 and 2019.
To continue America’s progress toward renewable energy, cities, states and the federal government should adopt strong policies to make it easy for homeowners, businesses and utilities to “go solar.”
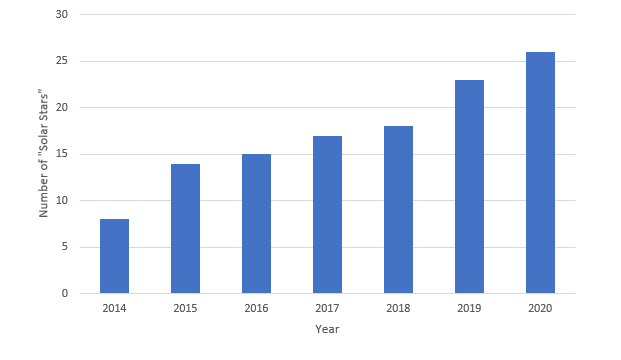
The cities with the most solar PV installed per resident are the “Solar Stars” – cities with 50 or more watts of solar PV capacity installed per capita. In 2013, only eight of the cities surveyed for this report had enough solar PV per capita to be ranked as “Solar Stars,” but now 26 cities have earned the title.
Figure ES-1. The number of “Solar Stars” (cities with >50W of solar PV per capita) in each edition of Shining Cities
Honolulu leads the United States for solar power per person among cities surveyed, followed by San Diego, Albuquerque and San Jose. All of the “Solar Stars” have experienced dramatic growth in solar energy and are setting the pace nationally for solar energy development.
Figure ES-2. Major U.S. cities by installed solar PV capacity per capita, end of 2019 (watts per person)
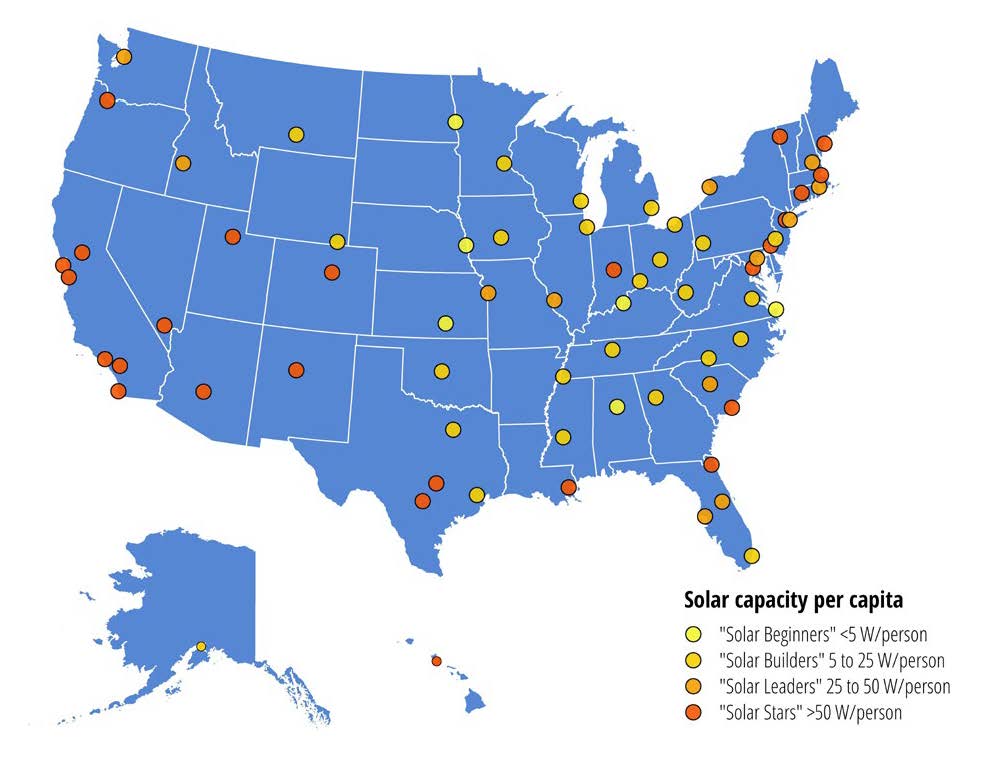
Photo by Staff | TPIN
Table ES-1. The “Solar Stars” (cities with 50 or more watts of solar PV per person, end of 2019)
| Per capita rank | City | State | Per capita solar PV (watts DC per person) | Change in per capita rank 2018 – 2019 | Total installed solar PV (MW DC) | Total solar PV rank |
|---|---|---|---|---|---|---|
| 1 | Honolulu | HI | 840.88 | 0 | 292.12 | 3 |
| 2 | San Diego | CA | 294.8 | 0 | 420.38 | 2 |
| 3 | Albuquerque | NM | 273.19 | 7 | 153.04 | 8 |
| 4 | San Jose | CA | 217.13 | -1 | 223.67 | 7 |
| 5 | Burlington | VT | 183.8 | -1 | 7.88 | 39 |
| 6 | San Antonio | TX | 166.08 | 6 | 254.47 | 5 |
| 7 | Las Vegas | NV | 164.1 | -2 | 105.79 | 10 |
| 8 | Phoenix | AZ | 164.07 | -2 | 272.4 | 4 |
| 9 | Riverside | CA | 154.17 | -1 | 50.89 | 17 |
| 10 | Denver | CO | 145.95 | -1 | 104.57 | 11 |
| 11 | Salt Lake City | UT | 141.17 | 0 | 28.32 | 22 |
| 12 | Indianapolis | IN | 141.01 | -5 | 122.28 | 9 |
| 13 | Washington | DC | 126.66 | 2 | 88.97 | 12 |
| 14 | New Orleans | LA | 125.06 | -1 | 48.9 | 18 |
| 15 | Los Angeles | CA | 121.24 | -1 | 483.8 | 1 |
| 16 | Sacramento | CA | 112.82 | 1 | 57.37 | 15 |
| 17 | Newark | NJ | 96.9 | -1 | 27.33 | 24 |
| 18 | Wilmington | DE | 81.65 | 9 | 5.77 | 47 |
| 19 | Jacksonville | FL | 70.4 | 0 | 63.63 | 13 |
| 20 | Hartford | CT | 69.8 | 3 | 8.56 | 38 |
| 21 | Austin | TX | 64.14 | 1 | 61.84 | 14 |
| 22 | San Francisco | CA | 62.11 | -2 | 54.86 | 16 |
| 23 | Portland | OR | 57.9 | 1 | 37.82 | 21 |
| 24 | Charleston | SC | 55.52 | -6 | 7.56 | 41 |
| 25 | Boston | MA | 55.51 | -4 | 38.56 | 20 |
| 26 | Portland | ME | 54.75 | -1 | 3.64 | 56 |
Almost 45 percent of the 57 cities surveyed in each edition of this report more than quadrupled their installed solar PV capacity from 2013 to 2019.
Los Angeles leads the nation in total installed solar PV capacity among all cities surveyed in this report, as it did from 2013 to 2015 and from 2017 to 2018, after briefly being topped by San Diego in 2016. Los Angeles has added over 215 MW of solar capacity since year-end 2016. (See Figure ES-3 and Table ES-2.)
Figure ES-3. Major U.S. cities by total installed solar PV capacity, end of 2019 (MW)
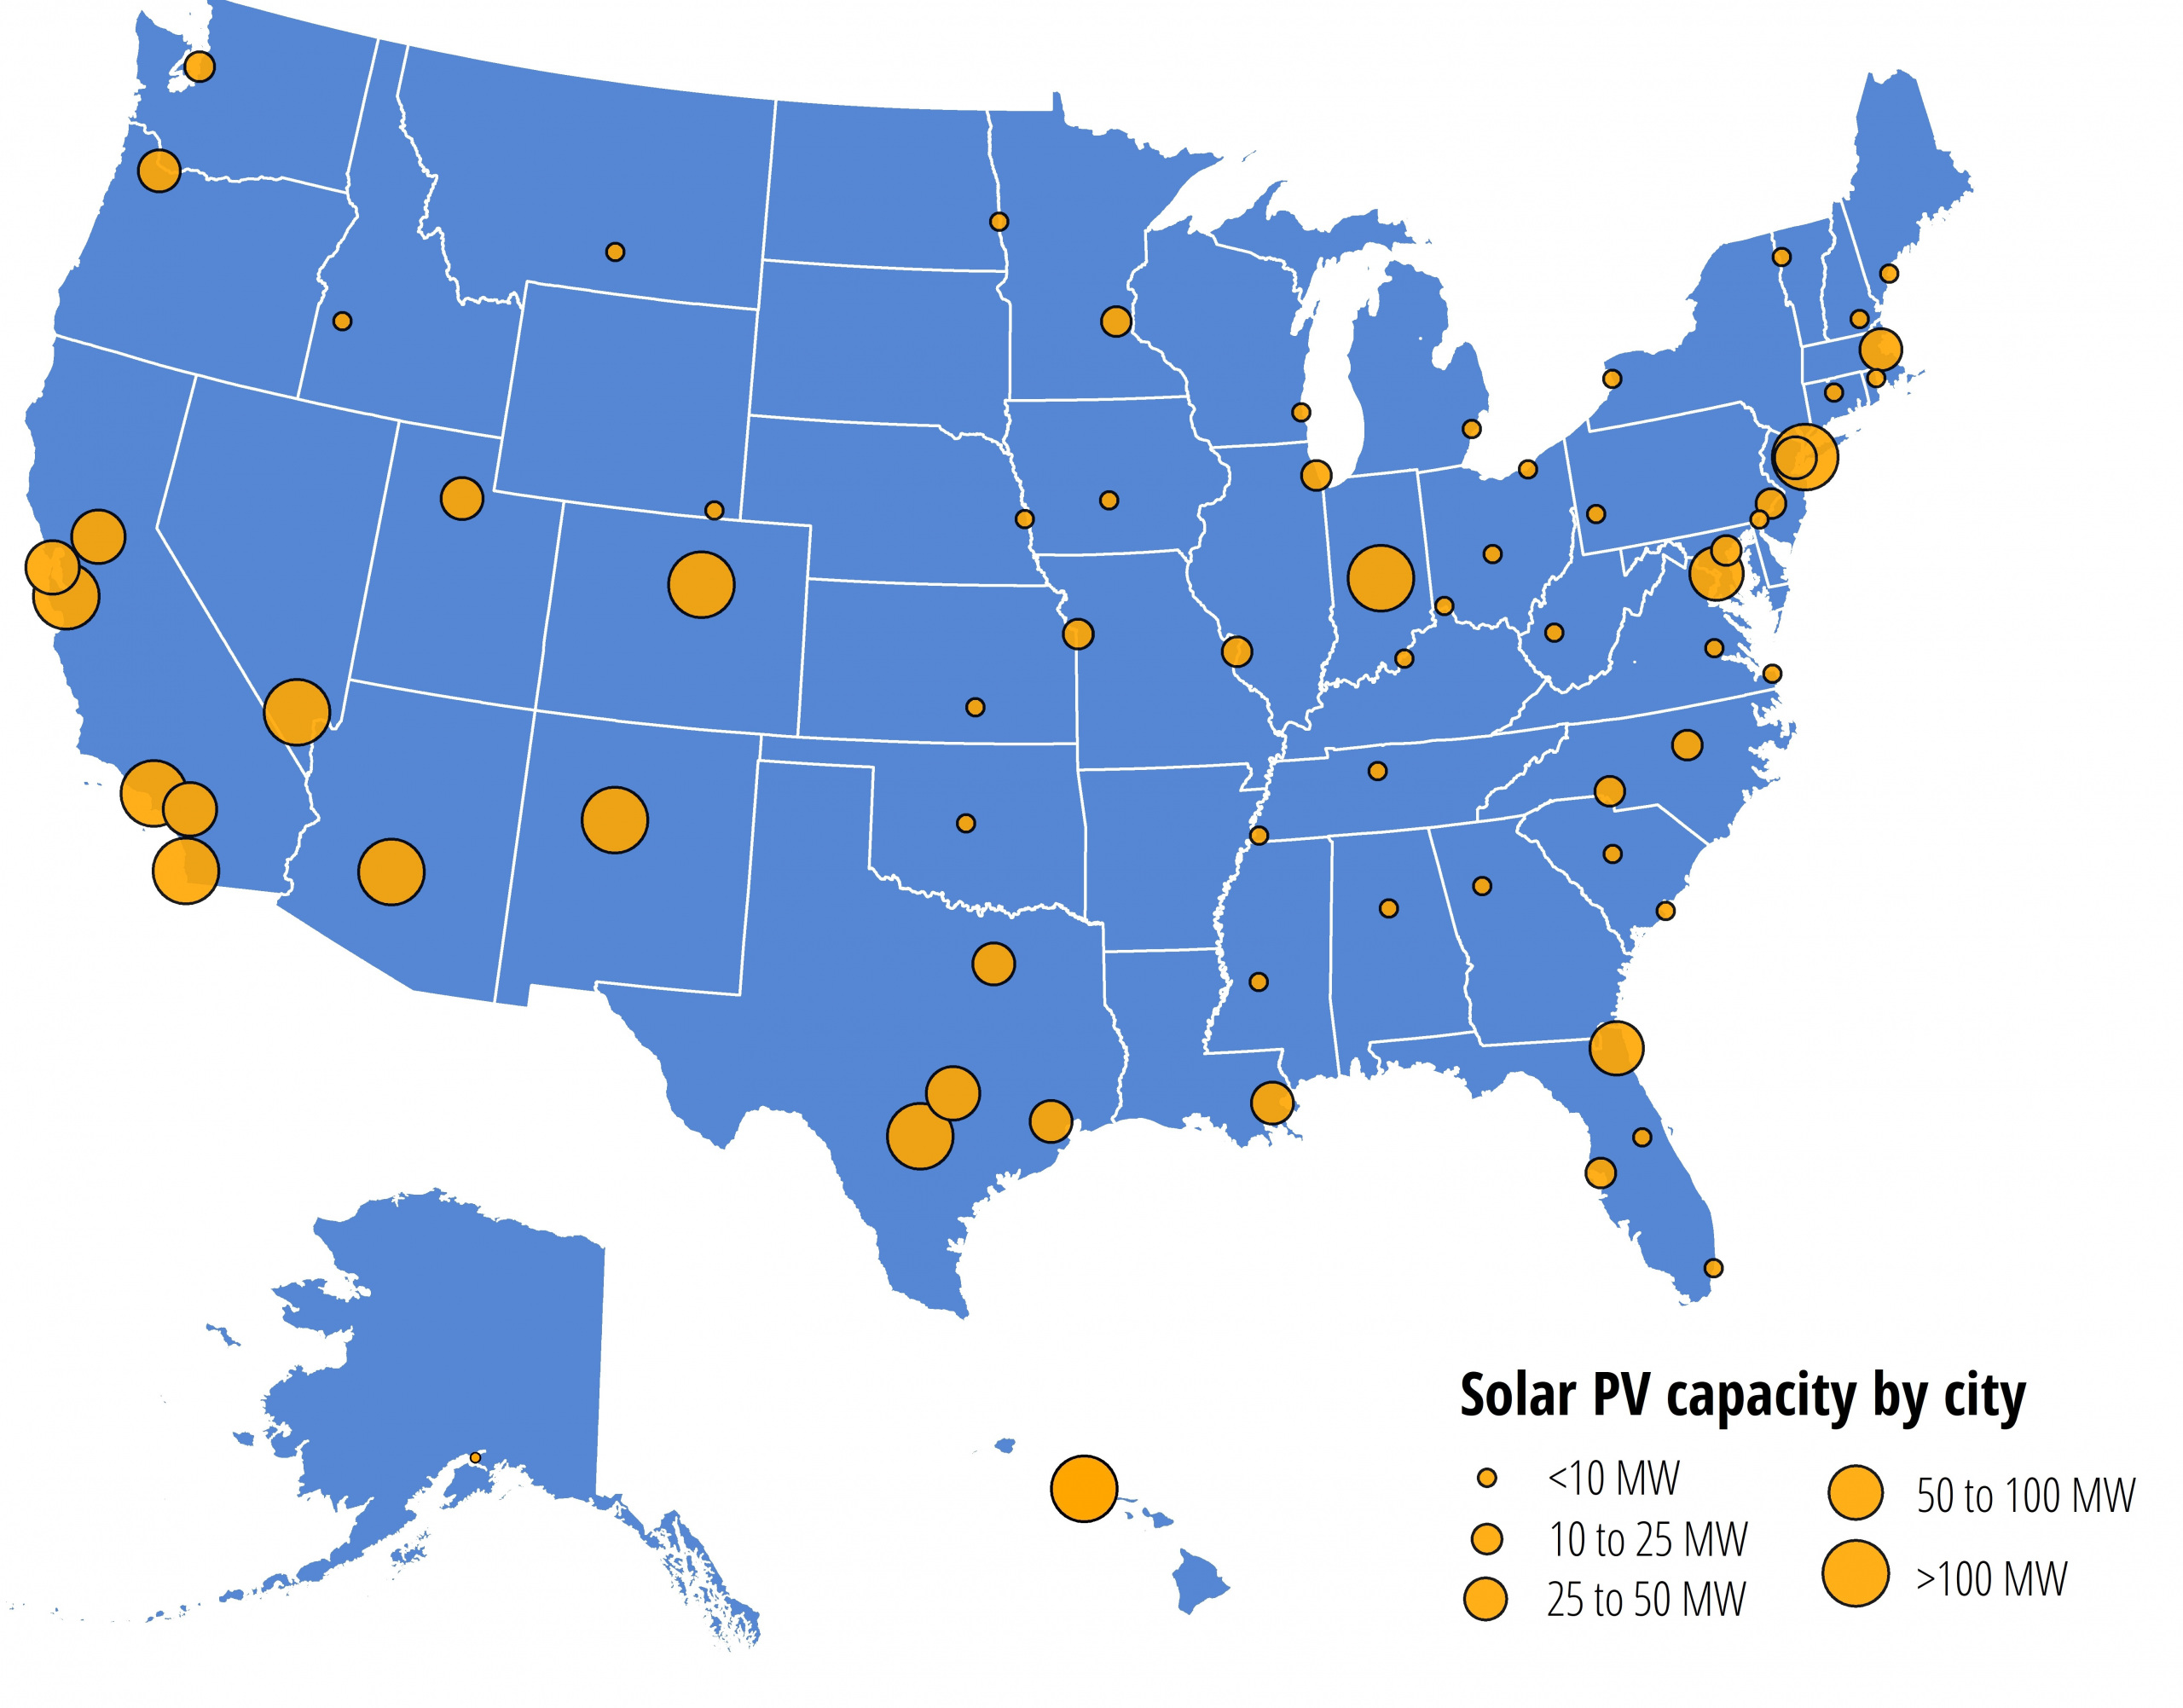
Table ES-2. Top 20 shining cities by total installed solar PV capacity, end of 2019
| Total solar PV rank | City | State | Total installed solar PV (MW DC) | Rooftop solar PV potential on small buildings (MW)ǂ | Population | Per capita rank | Per capita solar PV (watts DC per person) |
|---|---|---|---|---|---|---|---|
| 1 | Los Angeles | CA | 483.8 | 5,443.7 | 3,990,456 | 15 | 121.24 |
| 2 | San Diego | CA | 420.38 | 2,218.8 | 1,425,976 | 2 | 294.8 |
| 3 | Honolulu | HI | 292.12 | N/A | 347,397 | 1 | 840.88 |
| 4 | Phoenix | AZ | 272.4 | 2,981.4 | 1,660,272 | 8 | 164.07 |
| 5 | San Antonio | TX | 254.47 | 3,721.4 | 1,532,233 | 6 | 166.08 |
| 6 | New York | NY | 244.78 | 1,276.6 | 8,398,748 | 37 | 29.14 |
| 7 | San Jose | CA | 223.67 | 1,638.5 | 1,030,119 | 4 | 217.13 |
| 8 | Albuquerque | NM | 153.04 | 1,252.3 | 560,218 | 3 | 273.19 |
| 9 | Indianapolis | IN | 122.28 | N/A | 867,125 | 12 | 141.01 |
| 10 | Las Vegas | NV | 105.79 | 946 | 644,644 | 7 | 164.1 |
| 11 | Denver | CO | 104.57 | 677.4 | 716,492 | 10 | 145.95 |
| 12 | Washington | DC | 88.97 | 343.9 | 702,455 | 13 | 126.66 |
| 13 | Jacksonville | FL | 63.63 | 1,714.5 | 903,889 | 19 | 70.4 |
| 14 | Austin | TX | 61.84 | 1,443 | 964,254 | 21 | 64.14 |
| 15 | Sacramento | CA | 57.37 | 777.2 | 508,529 | 16 | 112.82 |
| 16 | San Francisco | CA | 54.86 | 671.5 | 883,305 | 22 | 62.11 |
| 17 | Riverside | CA | 50.89 | 612.1 | 330,063 | 9 | 154.17 |
| 18 | New Orleans | LA | 48.9 | 1,276.6 | 391,006 | 14 | 125.06 |
| 19 | Houston | TX | 42.53 | 4,604.7 | 2,325,502 | 44 | 18.29 |
| 20 | Boston | MA | 38.56 | 340.8 | 694,583 | 25 | 55.51 |
Leading solar cities can be found in every region of the country. Leaders in per capita solar capacity by census region include Honolulu in the Pacific region, Albuquerque in the Mountain region, Indianapolis in the North Central region, San Antonio in the South Central region, Washington, D.C. in the South Atlantic region, and Burlington, Vermont, in the Northeast region.
Many smaller cities and towns are also going big on solar energy.
Fossil fuel interests and some utilities are working to slow the growth of distributed solar energy. Over the past few years, many states have considered or passed rollbacks to net metering – the critical practice of crediting solar energy customers for the excess energy they supply to the grid. Additionally, some states and utilities continue to target solar customers with special fees, charges and rate designs in order to reduce the appeal and financial promise of installing solar panels. These changes, such as imposing demand charges and other electric bill fees only on solar customers specifically, could cause solar panel owners to pay as much for electricity as other customers, even though they consume less electricity from the grid.
U.S. cities have only begun to tap their solar energy potential. Some of the cities in this report could generate hundreds of times more solar power than they do today. A National Renewable Energy Laboratory (NREL) study estimated that building rooftops alone are technically capable of hosting 1,118 gigawatts – enough solar energy to cover the annual electricity needs of more than 130 million American homes. Cities can go even further by encouraging stand-alone utility-scale solar installations.
To take advantage of the nation’s vast solar energy potential and move America toward 100 percent renewable energy, city, state and federal governments should adopt a series of strong pro-solar policies.
Local governments should, among other things:
State governments should, among other things:
The federal government should, among other things:
Policy Analyst
Associate Director and Senior Policy Analyst, Frontier Group
Elizabeth Ridlington is associate director and senior policy analyst with Frontier Group. She focuses primarily on global warming, toxics, health care and clean vehicles, and has written dozens of reports on these and other subjects. Elizabeth graduated with honors from Harvard with a degree in government. She joined Frontier Group in 2002. She lives in Northern California with her son.