Clean energy is sweeping across America and is poised for more dramatic growth in the coming years.
Wind turbines and solar panels made up a tiny fraction of our energy infrastructure 10 years ago. Today, they are everyday parts of America’s energy landscape. The number of homes heated with clean, efficient electric heat pumps increased by 28% in a decade from 2005 to 2015. Just a few years ago, electric vehicles seemed a far-off solution to decarbonize our transportation system. Now, they have broken through to the mass market.
Virtually every day, there are new developments that increase our ability to produce renewable energy, apply it to a wider range of energy needs, and reduce our overall energy use. These developments enable us to envision an economy powered entirely by clean, renewable energy.
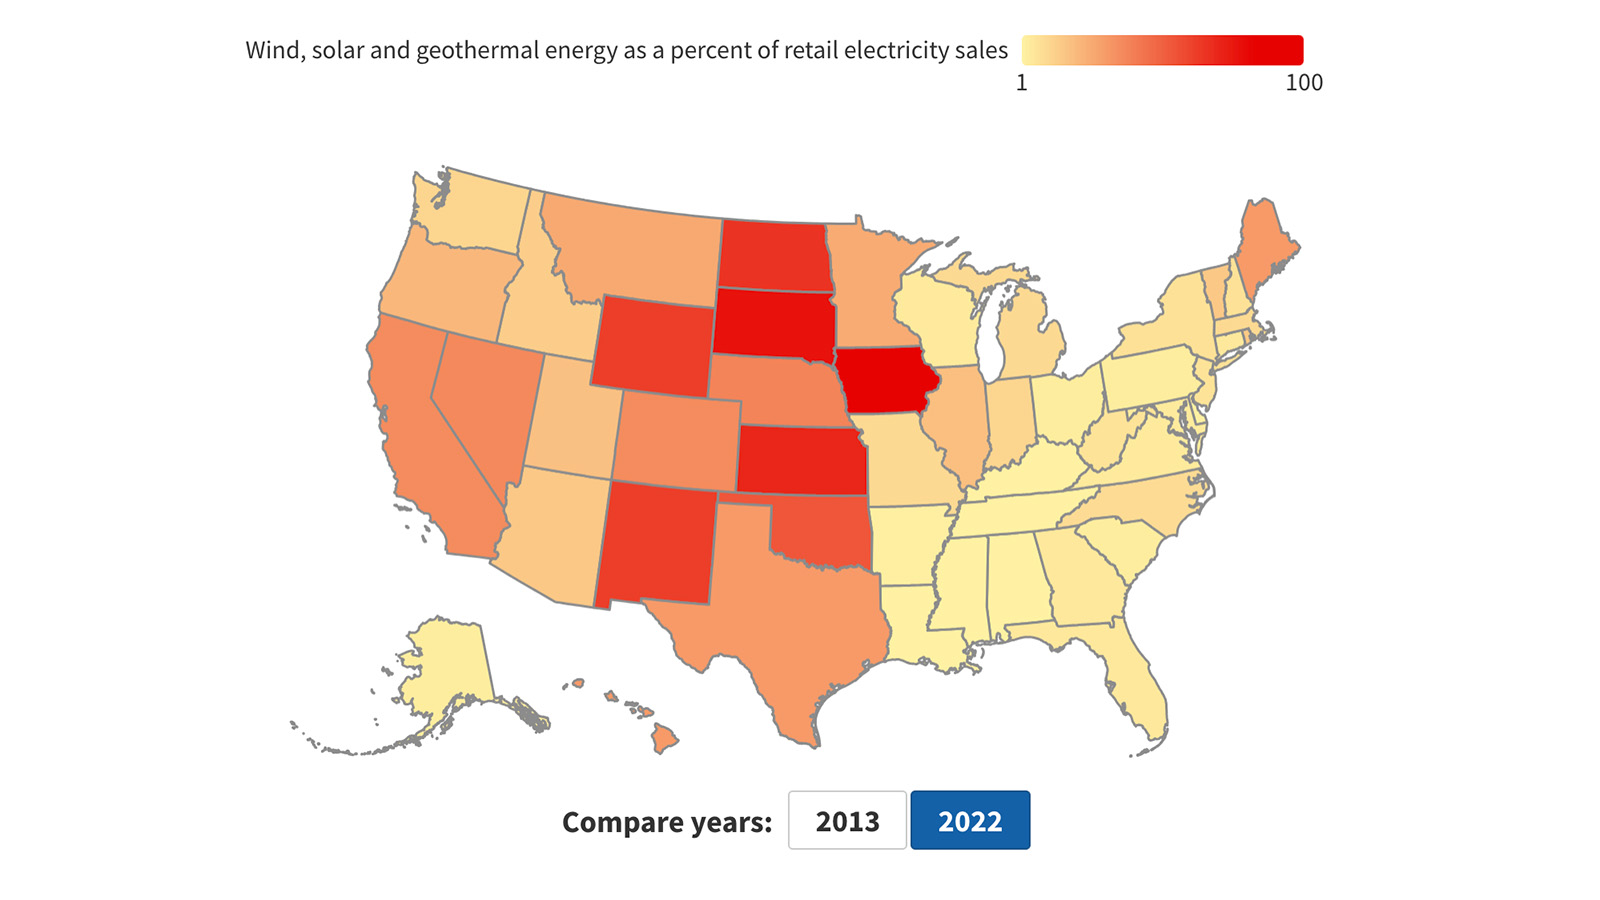
In 2020, America produced almost four times as much renewable electricity from the sun and the wind as in 2011, with wind and solar producing 11% of our nation’s electricity in 2020, up from 3% in 2011.
Between 2011 and 2020, U.S. wind, solar and geothermal generation grew at an annual rate of 15%. If those forms of renewable generation were to continue to grow by 15% per year, wind, solar and geothermal would produce enough electricity to meet all of our current electricity needs by 2035.
The last decade has proven that clean energy can power American homes, businesses and industry, and has put America on the cusp of a dramatic shift away from polluting energy sources. With renewable energy prices falling and new energy-saving technologies being developed every day, businesses, cities, states, and the nation should work to obtain 100% of our energy from clean, renewable sources.
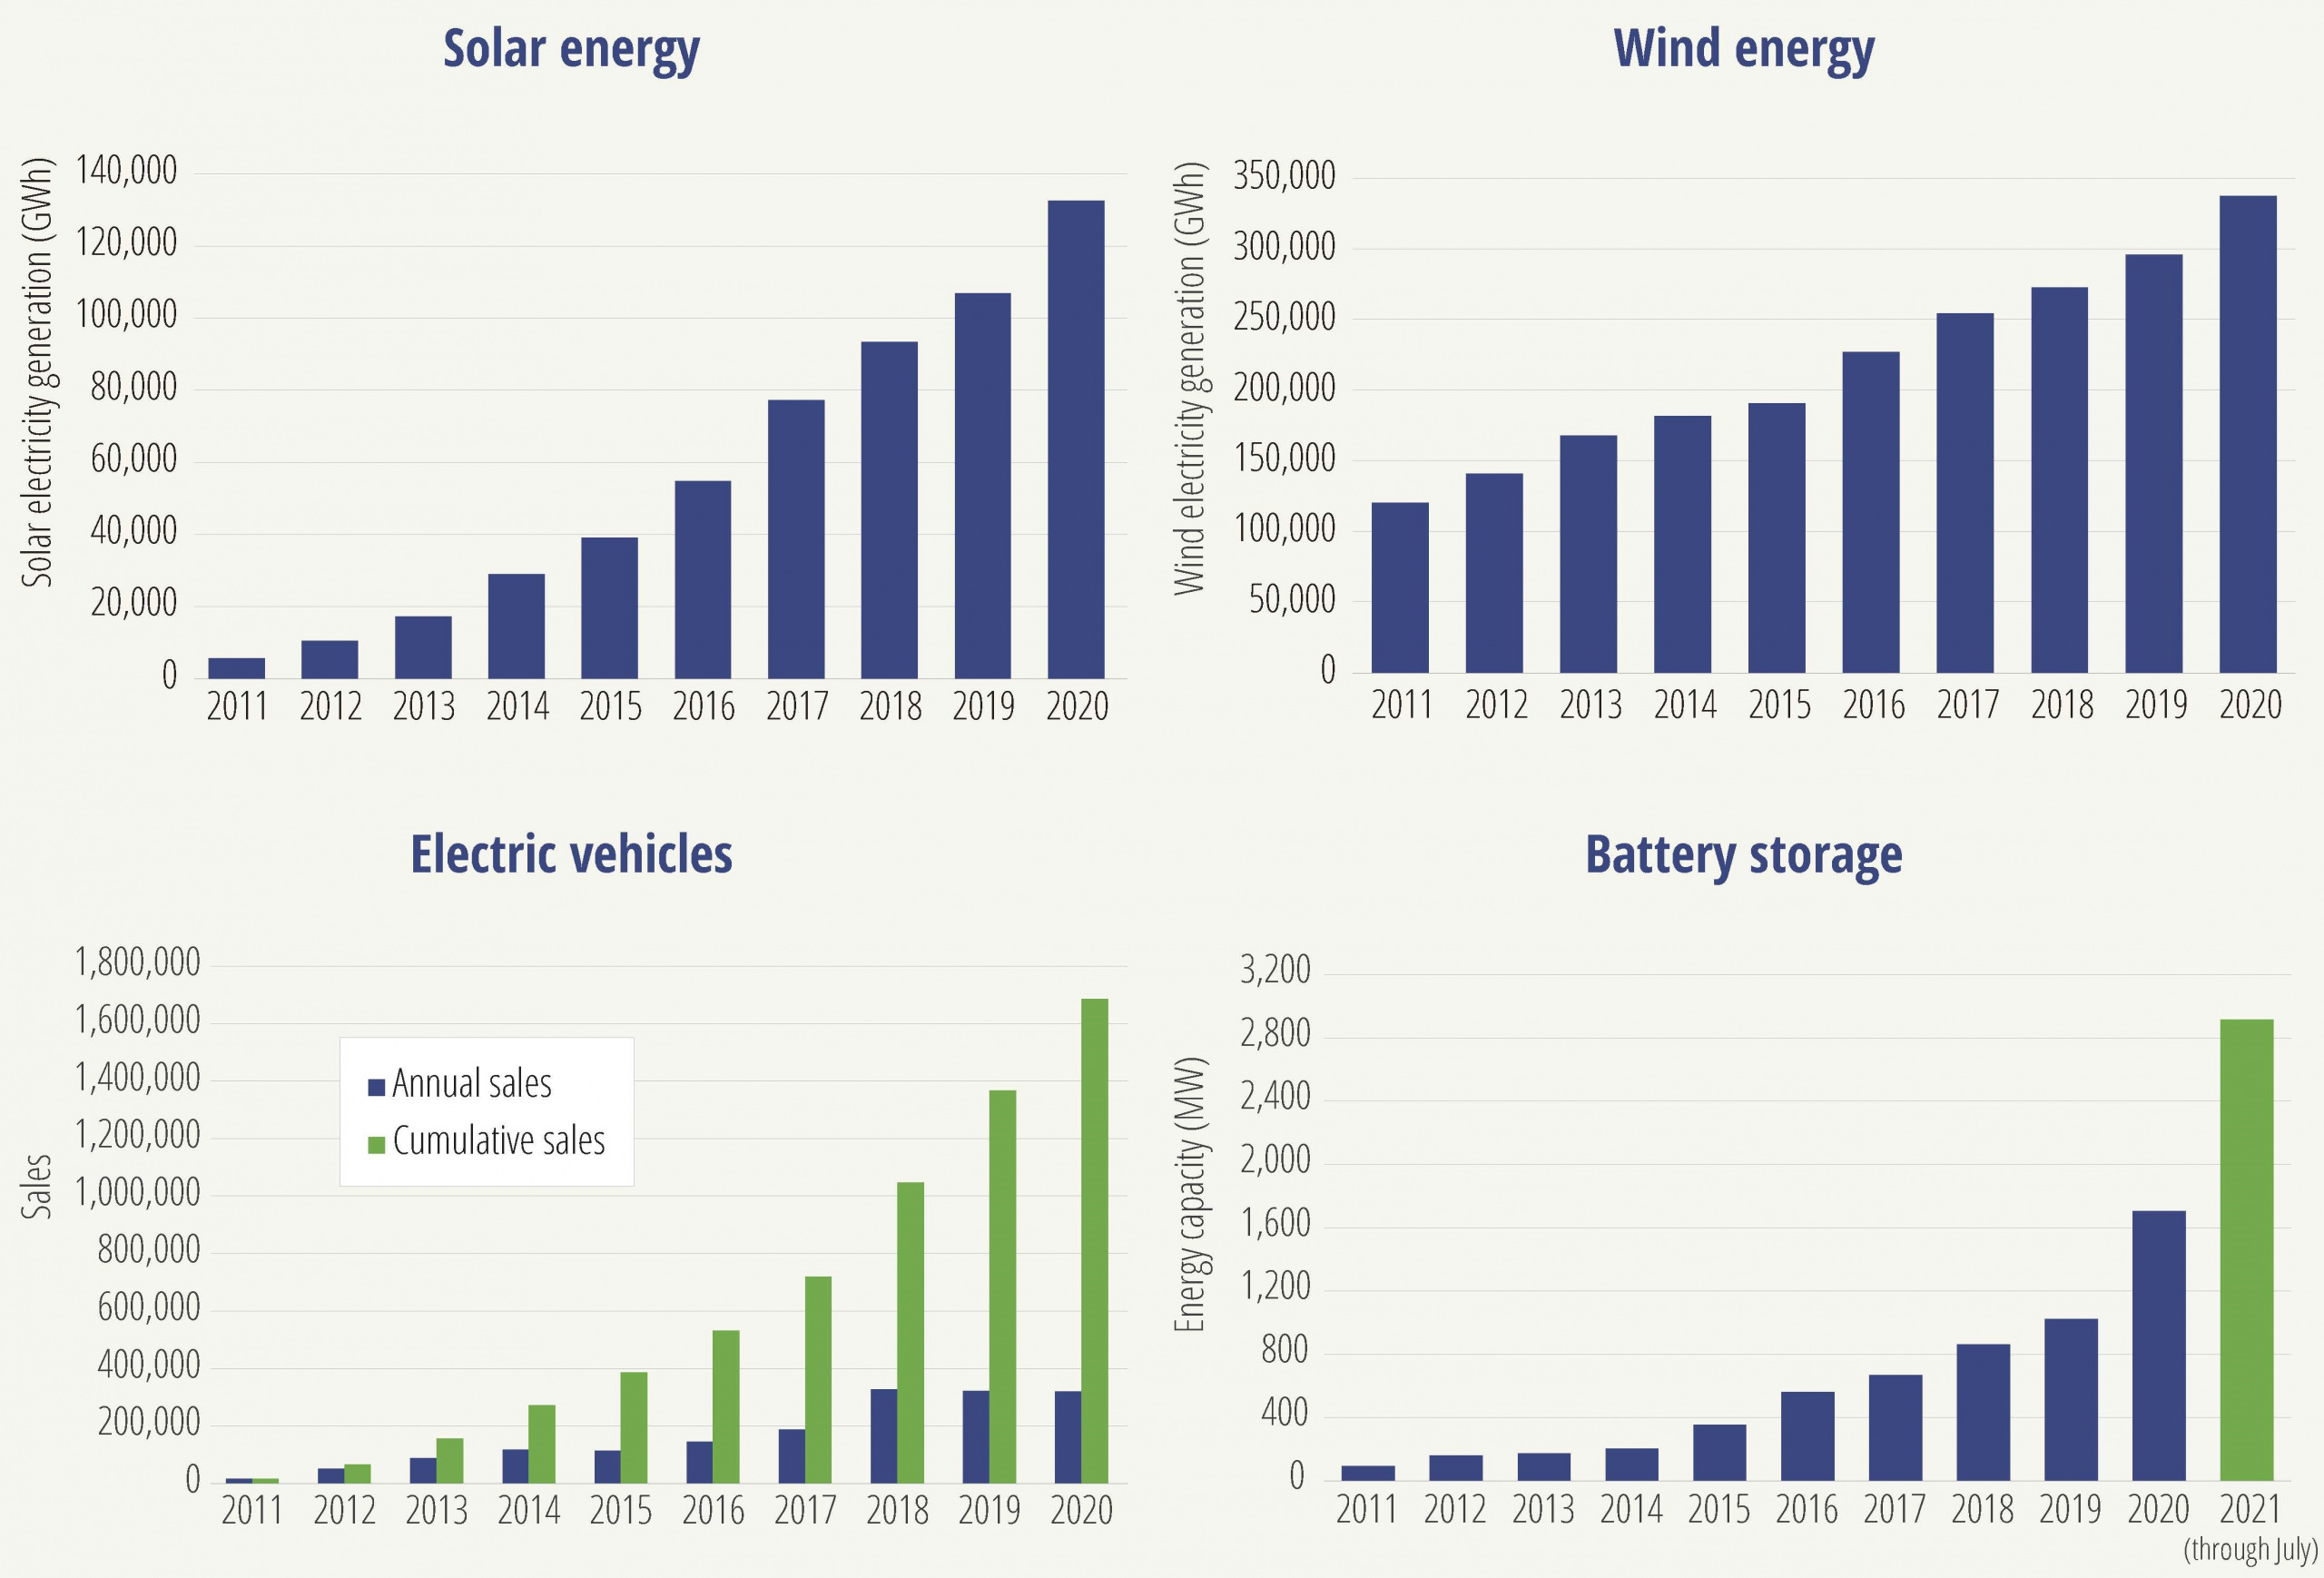
Figure ES-1. Growth in clean energy technologies
The last decade has seen explosive growth in the key technologies needed to power America with clean, renewable energy.
- Solar energy: America produces over 23 times as much solar power as it did in 2011, enough to power more than 12 million average American homes. In 2011, solar rooftops and utility-scale solar power plants produced 0.14% of U.S. electricity; in 2020, they produced 2.3% of America’s electricity. In 2019, the 2 millionth solar PV system was installed, and an additional million installations quickly followed by summer 2021.
- Wind energy: America has nearly tripled the amount of wind power it produces since 2011, enough to power over 31 million homes. In 2011, wind turbines produced 3% of the nation’s electricity; in 2020, they produced 8.4% of America’s electricity.
- Energy efficiency: Electric efficiency programs across the U.S. saved over 17% more energy in 2019 than in 2011, as states ramped up their investments in efficiency. In 2019, these programs saved enough electricity to power more than 2.5 million homes.
- Electric vehicles: In 2011, just over 16,000 battery and plug-in hybrid electric vehicles were sold in the U.S. As of December 2020, cumulative sales had grown 100-fold to nearly 1.7 million vehicles. By mid-2021, plug-in electric vehicle sales had surpassed 2 million.
- Battery storage: In 2020, the U.S. had over 1.7 GW of battery storage capacity. America’s battery storage capacity grew more than 18-fold from 2011 to 2020 and grew by 67% in 2020 alone.
- Heat pumps: The efficiency of heat pumps has improved to the point where they are now an attractive and realistic option for homes across the country. In 2015, 12% of all U.S. homes with heat used heat pumps, up from just 8% a decade earlier. Shipments of efficient air-source heat pumps from U.S. manufacturers nearly doubled between 2011 and 2020, increasing by 10% in 2020 alone.
The recent growth in renewable energy across America is due in part to strong and supportive public policies. To accelerate the transition to clean energy, cities, states and the federal government should:
- Set ambitious targets for renewable energy, following the example of the nine states and nearly 200 cities and towns that have committed to getting 100% of their electricity from clean or renewable sources of energy within the next several decades. In addition, governments should set specific targets for deployment of key clean energy technologies, such as solar power, offshore wind energy and energy storage.
- Establish strong incentives for renewable energy adoption, including extension of federal tax credits that have helped to fuel the growth of renewable energy over the last decade and local and state clean energy incentives. Policy-makers should expand and improve existing clean energy incentives to make them easier to use and to ensure that they deliver benefits to everyone wanting to participate in the drive toward a clean energy future.
- Ensure that utility policies fully and fairly compensate investors in clean energy technology for the benefits they bring to the environment, society and the electric system through mechanisms such as net metering for rooftop solar systems, and adopt policies for permitting and interconnection that make adoption of clean energy technologies easy and hassle-free.
- Encourage the transition to electric vehicles and electric buildings through strong clean cars standards, local commitments to transition to electric transit and school buses, and policies to support fuel-switching in residential and commercial buildings from gas and oil to electricity.
- Support the integration of technologies and practices that will enable America to take full advantage of its renewable energy potential, including the integration of energy storage into the grid, the development of resilient local microgrids powered by renewable energy, and the appropriate expansion of transmission infrastructure to allow for the transport of renewable energy from the places where it is abundant to the places where it is needed.
- Encourage continued steady progress on energy efficiency by continuing and expanding local, state, utility and federal programs and policies, including utility energy efficiency programs, building energy codes, and appliance efficiency standards.
Photo: Wind farm in eastern Washington, Gareth Janzen via shutterstock.com
- 2005: U.S. Energy Information Administration, 2005 Residential Energy Consumption Survey: Preliminary Housing Characteristics Tables, Table HC9.4 space heating characteristics by climate zone, 2005, 2005, accessed 21 October 2021 at https://www.eia.gov/consumption/residential/data/2005/hc/pdf/tablehc9.4.pdf; 2015: U.S. Energy Information Administration, 2015 Residential Energy Consumption Survey, Table HC6.1 Space heating in U.S. homes by housing unit type, 2015, revised May 2018 at https://www.eia.gov/consumption/residential/data/2015/hc/php/hc6.1.php.
- For 2014 and subsequent years, based on sum of net generation from utility-scale solar, small-scale solar and wind, divided by sum of all utility-scale generation plus small-scale solar. All data for 2014 and subsequent years from U.S. Energy Information Administration, Electricity Data Browser, accessed 15 August 2021 at https://www.eia.gov/electricity/data/browser/; For 2013 and previous years, based on sum of total solar energy consumption for all sectors and wind generation divided by (total solar energy consumption plus (utility-scale generation minus utility-scale solar)) with total solar energy consumption data from U.S. Energy Information Administration, State Energy Data System 2020 Update, accessed 7 September 2021 at https://www.eia.gov/state/seds/.
- U.S. Energy Information Administration, Electricity Data Browser, accessed 7 September 2021 at https://www.eia.gov/electricity/data/browser/.
- Based on 2020 generation from wind, solar and geothermal power and total U.S. net generation from U.S. Energy Information Administration, Electricity Data Browser: Net Generation for United States, downloaded 18 August 2021 from https://www.eia.gov/electricity/data/browser/#/topic/0?agg=2&fuel=vtvv&linechart=ELEC.GEN.ALL-US-99.A~ELEC.GEN.COW-US-99.A~ELEC.GEN.PEL-US-99.A~ELEC.GEN.PC-US-99.A~ELEC.GEN.NG-US-99.A~ELEC.GEN.OOG-US-99.A~ELEC.GEN.NUC-US-99.A~ELEC.GEN.HYC-US-99.A~ELEC.GEN.WND-US-99.A~ELEC.GEN.SUN-US-99.A~ELEC.GEN.GEO-US-99.A~ELEC.GEN.BIO-US-99.A~ELEC.GEN.WWW-US-99.A~ELEC.GEN.WAS-US-99.A~ELEC.GEN.HPS-US-99.A~ELEC.GEN.OTH-US-99.A~ELEC.GEN.TSN-US-99.A~ELEC.GEN.DPV-US-99.A&columnchart=ELEC.GEN.ALL-US-99.A&map=ELEC.GEN.ALL-US-99.A&freq=A&start=2001&end=2020&ctype=linechart<ype=pin&rtype=s&maptype=0&rse=0&pin=.
- Solar: U.S. Energy Information Administration, Electricity Data Browser, accessed 15 August 2021 at https://www.eia.gov/electricity/data/browser/; U.S. Energy Information Administration, State Energy Data System 2020 Update, downloaded 7 September 2021 from https://www.eia.gov/state/seds/seds-data-complete.php?sid=US; wind: U.S. Energy Information Administration, Electricity Data Browser: Net Generation for United States, downloaded 18 August 2021 from https://www.eia.gov/electricity/data/browser/#/topic/0?agg=2&fuel=vtvv&linechart=ELEC.GEN.ALL-US-99.A~ELEC.GEN.COW-US-99.A~ELEC.GEN.PEL-US-99.A~ELEC.GEN.PC-US-99.A~ELEC.GEN.NG-US-99.A~ELEC.GEN.OOG-US-99.A~ELEC.GEN.NUC-US-99.A~ELEC.GEN.HYC-US-99.A~ELEC.GEN.WND-US-99.A~ELEC.GEN.SUN-US-99.A~ELEC.GEN.GEO-US-99.A~ELEC.GEN.BIO-US-99.A~ELEC.GEN.WWW-US-99.A~ELEC.GEN.WAS-US-99.A~ELEC.GEN.HPS-US-99.A~ELEC.GEN.OTH-US-99.A~ELEC.GEN.TSN-US-99.A~ELEC.GEN.DPV-US-99.A&columnchart=ELEC.GEN.ALL-US-99.A&map=ELEC.GEN.ALL-US-99.A&freq=A&start=2001&end=2020&ctype=linechart<ype=pin&rtype=s&maptype=0&rse=0&pin=; electric vehicles: Alliance for Automotive Innovation, The Electric Vehicle Sales Dashboard, accessed 11 August 2021 at https://www.autosinnovate.org/resources/electric-vehicle-sales-dashboard; battery storage: U.S. Energy Information Administration, Form EIA-860 Detailed Data with Previous Form Data (EIA-860A/860B), 3 June 2021, downloaded 14 August 2021 from https://www.eia.gov/electricity/data/eia860/; U.S. Energy Information Administration, Preliminary Monthly Electric Generator Inventory (based on Form EIA-860M as a supplement to Form EIA-860), 24 June 2021, downloaded 15 July 2021 from https://www.eia.gov/electricity/data/eia860m/.
- 23 times more solar: U.S. Energy Information Administration, Electricity Data Browser, accessed 15 August 2021 at https://www.eia.gov/electricity/data/browser/; U.S. Energy Information Administration, State Energy Data System 2020 Update, downloaded 7 September 2021 from https://www.eia.gov/state/seds/seds-data-complete.php?sid=US; Average American homes: U.S. Energy Information Administration, Frequently Asked Questions (FAQs): How much electricity does an American home use?, updated 9 October 2020, archived at http://web.archive.org/web/20210421225706/https://www.eia.gov/tools/faqs/faq.php?id=97.
- 2 millionth: Solar Energy Industries Association, United States Surpasses 2 Million Solar Installations (press release), 9 May 2019, archived at https://web.archive.org/web/20211019155542/https://www.seia.org/news/united-states-surpasses-2-million-solar-installations; additional million: U.S. Department of Energy, DOE Kicks Off “Summer of Solar 2021” With Tool That Fast-Tracks Solar Power For Communities Nationwide, 15 July 2021, archived at http://web.archive.org/web/20210828204022/https://www.energy.gov/articles/doe-kicks-summer-solar-2021-tool-fast-tracks-solar-power-communities-nationwide.
- Nearly tripled: U.S. Energy Information Administration, Electricity Data Browser, accessed 15 August 2021 at https://www.eia.gov/electricity/data/browser/; U.S. Energy Information Administration, State Energy Data System 2020 Update, downloaded 7 September 2021 from https://www.eia.gov/state/seds/seds-data-complete.php?sid=US; U.S. Energy Information Administration, Frequently Asked Questions (FAQs): How much electricity does an American home use?, updated 9 October 2021, archived at http://web.archive.org/web/20210421225706/https://www.eia.gov/tools/faqs/faq.php?id=97.
- U.S. Energy Information Administration, Electricity Data Browser, accessed 15 August 2021 at https://www.eia.gov/electricity/data/browser/; U.S. Energy Information Administration, State Energy Data System 2020 Update, downloaded 7 September 2021 from https://www.eia.gov/state/seds/seds-data-complete.php?sid=US.
- 2011: The American Council for an Energy-Efficient Economy (ACEEE), The 2013 State Energy Efficiency Scorecard, 4 November 2013, archived at http://web.archive.org/web/20210627173103/https://www.aceee.org/sites/default/files/publications/researchreports/e13k.pdf; 2019: The American Council for an Energy-Efficient Economy (ACEEE), The 2020 State Energy Efficiency Scorecard, 16 December 2020, archived at http://web.archive.org/web/20210501220112/https://www.aceee.org/research-report/u2011; Average American homes: U.S. Energy Information Administration, Frequently Asked Questions (FAQs): How much electricity does an American home use?, updated 9 October 2020, archived at http://web.archive.org/web/20210421225706/https://www.eia.gov/tools/faqs/faq.php?id=97.
- Alliance for Automotive Innovation, The Electric Vehicle Sales Dashboard, accessed 11 August 2021 at https://www.autosinnovate.org/resources/electric-vehicle-sales-dashboard.
- Argonne National Laboratory, Light Duty Electric Drive Vehicles Monthly Sales Updates, accessed 10 September 2021 at https://www.anl.gov/es/light-duty-electric-drive-vehicles-monthly-sales-updates.
- U.S. Energy Information Administration, Form EIA-860 Detailed Data with Previous Form Data (EIA-860A/860B), 3 June 2021, downloaded 14 August 2021 from https://www.eia.gov/electricity/data/eia860/; U.S. Energy Information Administration, Preliminary Monthly Electric Generator Inventory (based on Form EIA-860M as a supplement to Form EIA-860), 24 June 2021, downloaded 15 July 2021 from https://www.eia.gov/electricity/data/eia860m/.
- U.S. Energy Information Administration, “One in four U.S. homes is all-electric,” Today in Energy, 1 May 2019, archived at https://web.archive.org/web/20210911140229/https://www.eia.gov/todayinenergy/detail.php?id=39293.
- 94% increase between 2011 and 2020: Air-Conditioning, Heating and Refrigeration Institute, AHRI Releases December 2020 U.S. Heating and Cooling Equipment Shipment Data, 12 February 2021, archived at https://web.archive.org/web/20210814001020/https://www.ahrinet.org/App_Content/ahri/files/Statistics/Monthly%20Shipments/2020/December_2020.pdf, and Air-Conditioning, Heating and Refrigeration Institute, AHRI Releases December 2012 U.S. Heating and Cooling Equipment Shipment Data, 19 February 2013, archived at https://web.archive.org/web/20210730032433/https://www.ahrinet.org/App_Content/ahri/files/Statistics/Monthly%20Shipments/2012/December2012.pdf.
- Nine states: Maine, New York, Virginia, New Mexico, Washington, Oregon, California and Hawaii, plus Illinois, which adopted a 100% clean energy standard in September 2021. All states but Illinois: Environment America, Our Campaigns: 100% Renewable, accessed 21 September 2021, archived at https://web.archive.org/web/20210921193458/https://environmentamerica.org/feature/ame/100-renewable; Illinois: NPR Illinois, “Pritzker signs climate plan to get Illinois on a path to 100% clean energy with help from ratepayer hike,” 15 September 2021, archived at https://web.archive.org/web/20210921041608/https://www.nprillinois.org/statehouse/2021-09-15/pritzker-signs-climate-plan-to-get-illinois-on-path-to-100-clean-energy-with-help-from-ratepayer-hike; nearly 200 cities: Sierra Club, Ready for 100: Committed, accessed 21 September 2021, archived at https://web.archive.org/web/20210921193917/https://www.sierraclub.org/ready-for-100/commitments.