
Following the Money 2018
How the 50 States Rate in Providing Online Access to Government Spending Data
State-operated transparency websites provide checkbook-level detail on government spending, allowing citizens and watchdog groups to view payments made to individual companies, details on purchased goods or services, and benefits obtained in exchange for public subsidies. All 50 states now operate websites to make information on state expenditures accessible to the public. Yet while many have made continued improvements in transparency websites, Following the Money 2018 finds that states still have a long way to go in making critical data about state spending truly accessible to the public.

Downloads
State governments spend hundreds of billions of dollars each year on everything from employee salaries and office supplies to professional lawyers and subsidies to encourage economic development. Public accountability helps ensure that state funds are spent wisely.
State-operated transparency websites provide checkbook-level detail on government spending, allowing citizens and watchdog groups to view payments made to individual companies, details on purchased goods or services, and benefits obtained in exchange for public subsidies.
All 50 states now operate websites to make information on state expenditures accessible to the public. All but four states provide checkbook-level data for one or more economic development subsidy programs and more than half of states make that subsidy data available for researchers to download and analyze. These websites not only provide citizens with useful information, they are regularly used by citizens; in 2017 alone, at least 1.5 million users viewed over 8.7 million pages on state transparency websites.
However, this analysis – U.S. PIRG Education Fund’s eighth evaluation of state transparency websites – finds that despite continued improvements in transparency websites, states still have a long way to go in making critical data about state spending truly accessible to the public. (See Figure ES-1 and Table ES-1.) State governments should follow the example set by the nation’s “Leading States” in enabling their residents to “follow the money” on state spending.
Figure ES-1. How the 50 States Rate in Providing Online Access to Government Spending Data
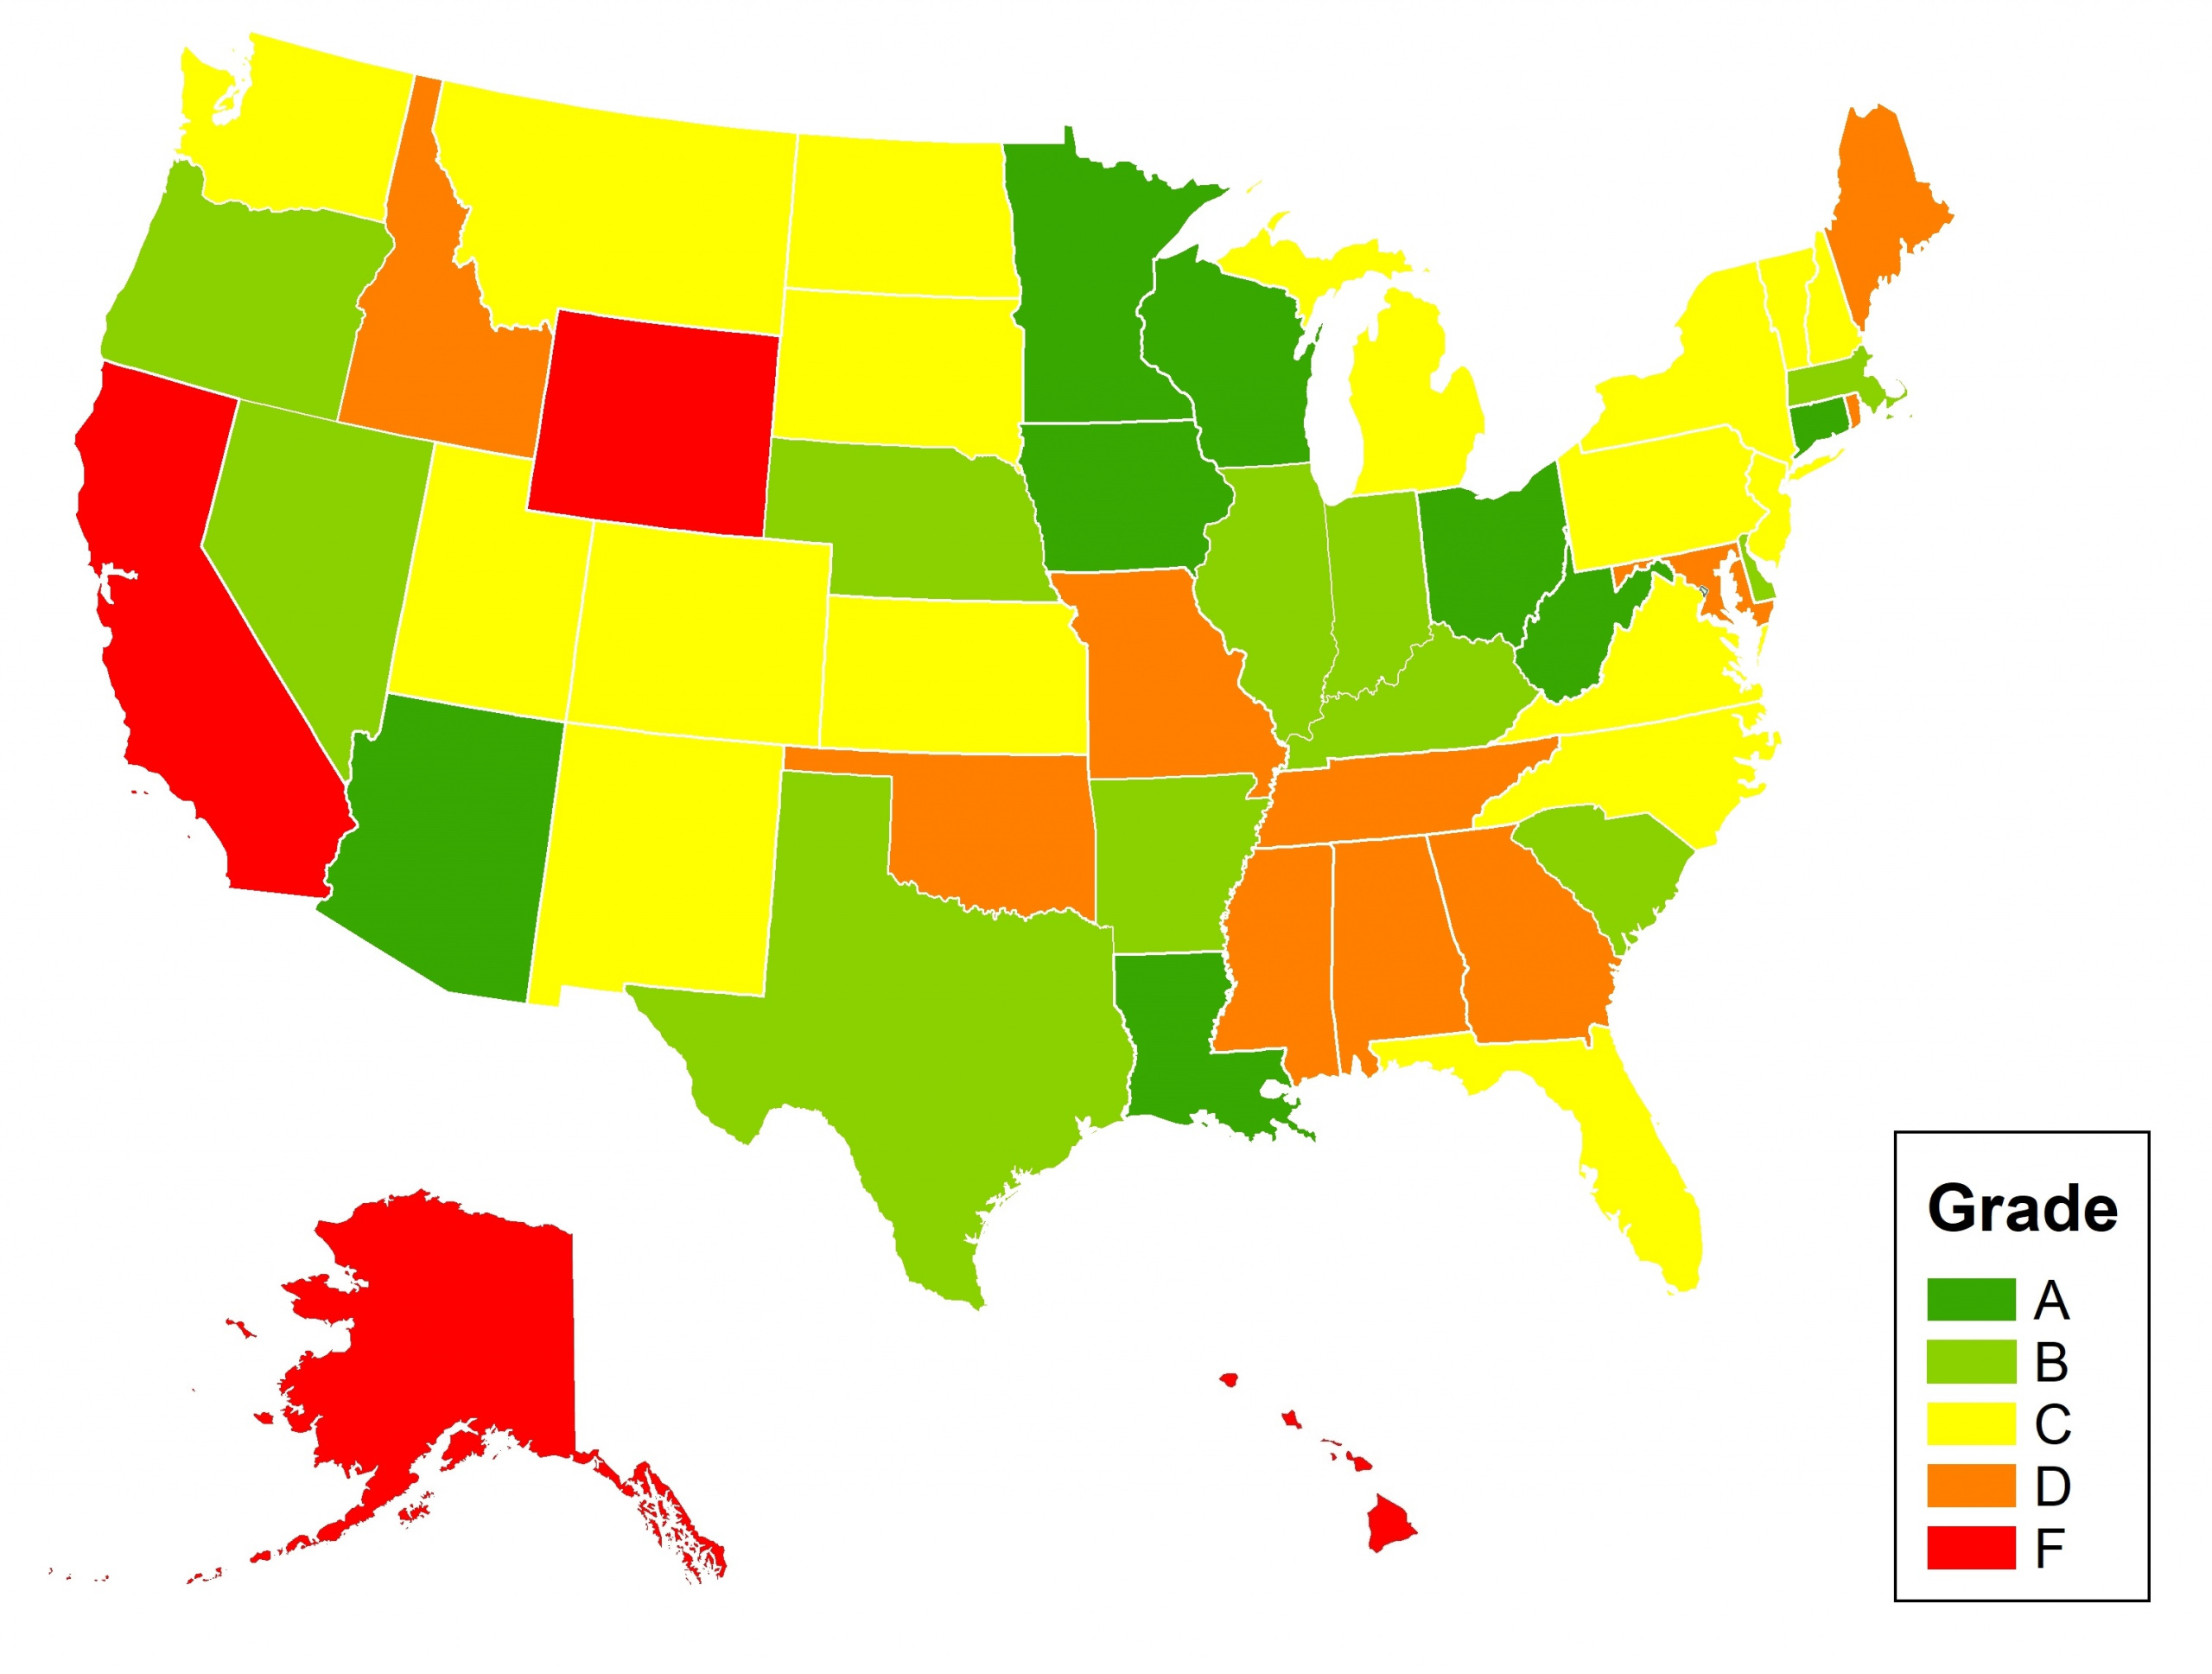
Table ES-1: Top 10 and Bottom 10 States in Providing Online Access to Government Spending Data
| Top 10 States | Bottom 10 States | ||||||
| State | Grade | Score | Rank | State | Grade | Score | Rank |
| Ohio | A+ | 98 | 1 (tie) | Wyoming | F | 35 | 50 |
| West Virginia | A+ | 98 | 1 (tie) | Alaska | F | 46 | 49 |
| Minnesota | A | 94 | 3 (tie) | California | F | 47 | 48 |
| Wisconsin | A | 94 | 3 (tie) | Hawaii | F | 48 | 47 |
| Arizona | A- | 93 | 5 (tie) | Tennessee | D- | 54 | 46 |
| Connecticut | A- | 93 | 5 (tie) | Rhode Island | D | 55 | 45 |
| Iowa | A- | 91 | 7 | Alabama | D | 56 | 44 |
| Louisiana | A- | 90 | 8 | Georgia | D | 57 | 43 |
| South Carolina | B+ | 87 | 9 | Idaho | D | 58 | 42 |
| Kentucky | B | 85 | 10 (tie) | Oklahoma | D+ | 60 | 41 |
| Nevada | B | 85 | 10 (tie) | ||||
| Confirmations of Findings with State Officials
Our researchers sent initial assessments and a list of questions to transparency website officials in all 50 states in order to ensure that the information presented in this report is accurate and up to date. For the majority of the grades, state transparency officials were given the opportunity to verify information, clarify their online features, and discuss the benefits of transparency best practices in their states. Of the 50 states, officials from 41 states provided feedback. For a list of the questions posed to state officials, please see Appendix C. Due to the nature of the new “Real World” test – in which states were graded on the ability of a reviewer to find information on a state website within a given period of time – states were not offered the ability to review the results of that portion of the evaluation. States were alerted to the purpose of and methods to be used in the Real World evaluation during our initial contact with them in winter 2018. |
Eight states, led by Ohio and West Virginia, are leading in spending transparency, setting an example for other states nationwide.
- Leading States (“A” range): Eight states are leading the charge in online spending transparency. These states have created user-friendly websites that provide visitors with accessible and comprehensive information on state spending. Citizens can access information on specific expenditures through easy-to-use features, including a multi-tiered search function that allows users to search for two or more criteria at once.
- Advancing States (“B” range): 11 states are advancing in online spending transparency, with spending information that is easy to access but more limited than the information provided by Leading States. All of these states host online checkbooks that are downloadable as well as searchable by recipient, keyword and agency, and all but Oregon include a subtotaling function that sums spending by department and category automatically for users.
- Middling States (“C” range): This year, 17 states are “Middling” in online spending transparency. Their online checkbooks have the same basic search functionality as those in Leading and Advancing States, but lack other usability tools and provide limited information on subsidies or other “off budget” expenditures.
- Lagging States (“D” range): The 10 Lagging States fail to provide users with essential tools for using and understanding the data posted in their checkbook portals, and trail behind other states in providing specific information about the expected and actual benefits delivered by economic development subsidy programs.
- Failing States (“F” range): Four states fail to meet the basic standards of online spending transparency. For example, Wyoming’s checkbook lacks a fully functional search feature, while Hawaii has not posted any spending data for years after 2016.
Many states have a long way to go in providing comprehensive information that is accessible to the public. In order to grade state transparency websites on their comprehensiveness and usability, 27 professional and amateur researchers participated in our focus groups, looking for six specific expenditures on state sites and evaluating how easily they were able to find and understand the information. Many websites failed to match the user-friendliness and intuitiveness common to Americans’ everyday experience of the Internet.
- Only three states – Kentucky, Arkansas and South Carolina – proved comprehensive by hosting all six of the test expenditures in an easily accessible format in the online checkbook for fiscal year 2017.
- Researchers were able to locate three or fewer of the six test expenditures on 30 states’ websites; of those, researchers were unable to locate any of the expenditures in 13 states.
- Only 34 states provide for automatic generation of subtotals for spending by department or expenditure category, a feature that helps ensure that spending data is easy to find and understand for users.
- Only 24 states provide a multi-tiered search function that allows users to narrow their results by searching within department and expenditure categories simultaneously, or by conducting a second search inside the parameters of their first.
All states, including Leading States, have opportunities to improve their transparency.
- Only 33 states provide checkbook-level information that includes the recipients of economic development subsidy programs, based on an analysis of three such programs in each state. (See page 37 of the methodology for details.) Disclosure for all programs would provide greater transparency and accountability.
- Four states – Alabama, California, Tennessee and Vermont – do not provide tax expenditure reports on their transparency websites that detail the impact on the state budget of targeted tax credits, exemptions or deductions.
- No state provides a comprehensive list of government entities outside the standard state budget. Ideally, all governmental and quasi-governmental entities – even those that are entirely financially self-supporting – would integrate their expenditures into the online checkbook, and a central registry of all such entities would be available for public reference. Some states provide comprehensive information on quasi-public agencies, but other entities like special districts are still excluded.
Table ES-2: How the 50 States Rate in Providing Online Access to Government Spending Data
| State | Grade | Score |
| Alabama | D | 56 |
| Alaska | F | 46 |
| Arizona | A- | 93 |
| Arkansas | B- | 82 |
| California | F | 47 |
| Colorado | C+ | 78 |
| Connecticut | A- | 93 |
| Delaware | B- | 80 |
| Florida | C+ | 76 |
| Georgia | D | 57 |
| Hawaii | F | 48 |
| Idaho | D | 58 |
| Illinois | B | 84 |
| Indiana | B | 83 |
| Iowa | A- | 91 |
| Kansas | C | 73 |
| Kentucky | B | 85 |
| Louisiana | A- | 90 |
| Maine | D+ | 62 |
| Maryland | D+ | 63 |
| Massachusetts | B- | 80 |
| Michigan | C+ | 78 |
| Minnesota | A | 94 |
| Mississippi | D+ | 63 |
| Missouri | D+ | 62 |
| State | Grade | Score |
| Montana | C- | 69 |
| Nebraska | B- | 80 |
| Nevada | B | 85 |
| New Hampshire | C | 73 |
| New Jersey | C- | 67 |
| New Mexico | C+ | 75 |
| New York | C+ | 78 |
| North Carolina | C+ | 76 |
| North Dakota | C- | 68 |
| Ohio | A+ | 98 |
| Oklahoma | D+ | 60 |
| Oregon | B- | 81 |
| Pennsylvania | C | 73 |
| Rhode Island | D | 55 |
| South Carolina | B+ | 87 |
| South Dakota | C | 72 |
| Tennessee | D- | 54 |
| Texas | B- | 82 |
| Utah | C+ | 78 |
| Vermont | C- | 67 |
| Virginia | C | 74 |
| Washington | C | 71 |
| West Virginia | A+ | 98 |
| Wisconsin | A | 94 |
| Wyoming | F | 35 |
Topics
Authors
Find Out More

Shifting Gears
Fix it First

Moving Forward Together