
Declining Per-Capita VMT: A Broad-Based Trend
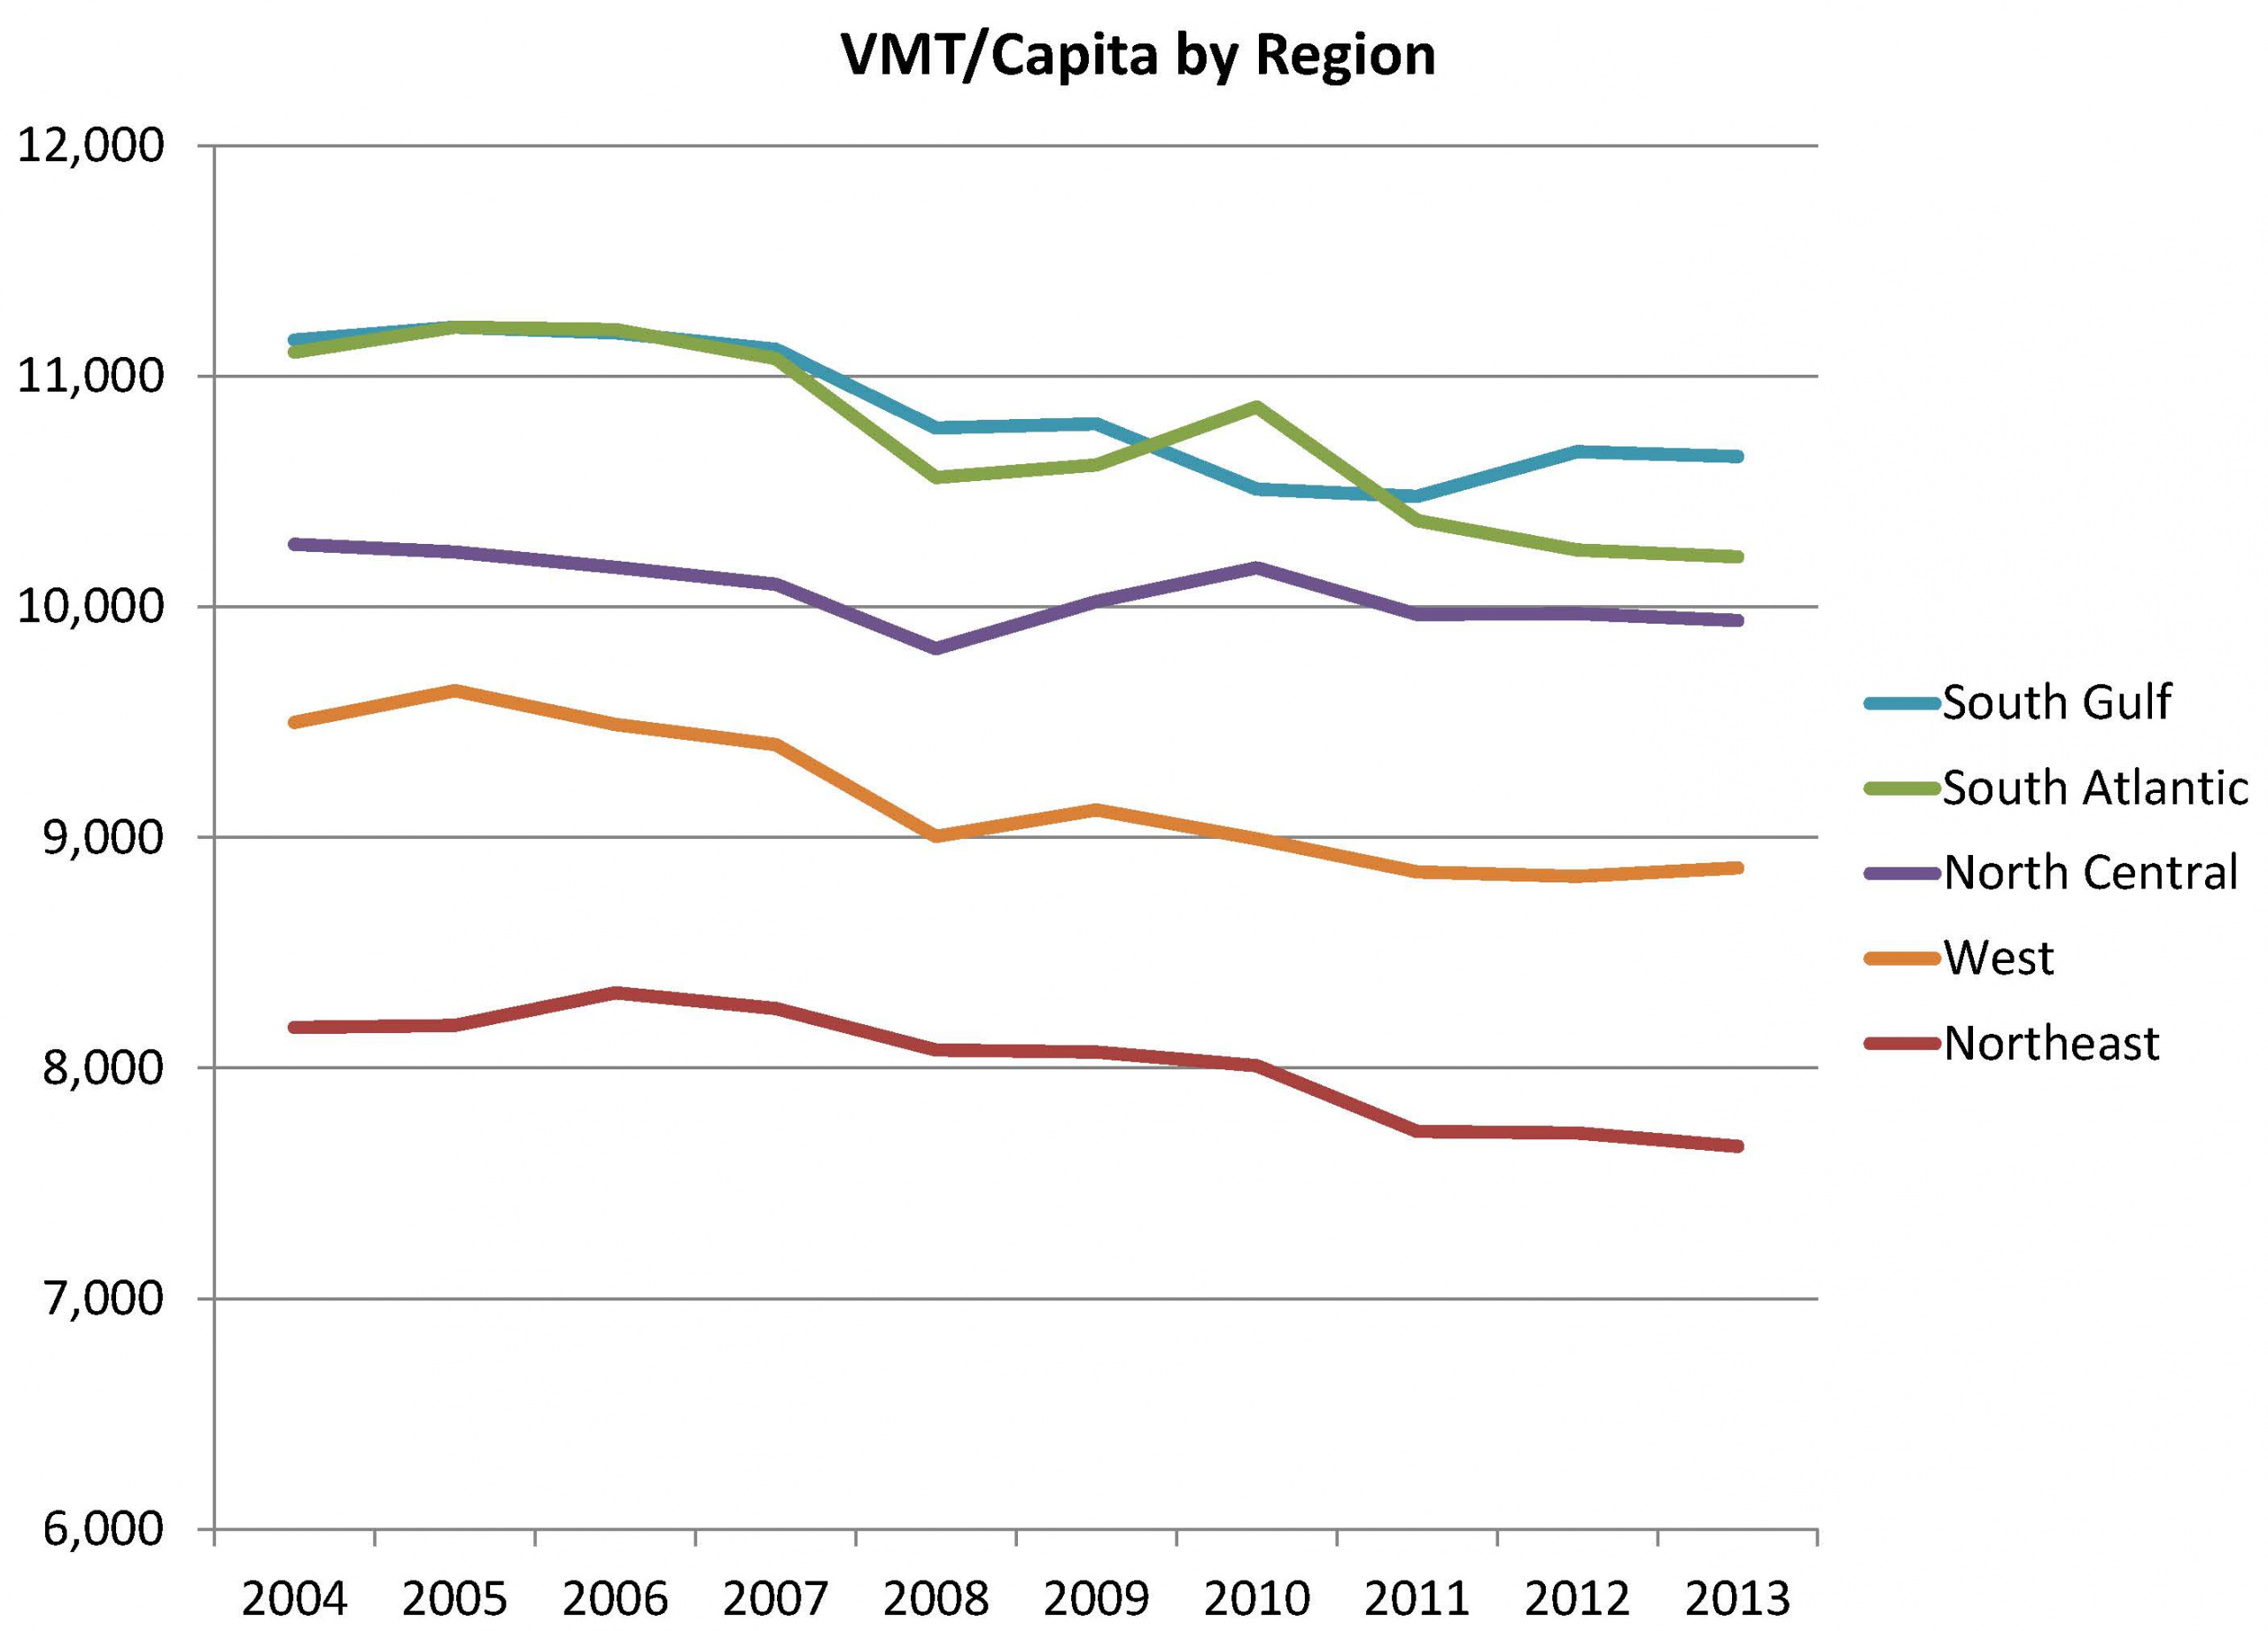
Since 2004, the South Atlantic region saw the largest decrease in VMT per capita, declining 8 percent relative to 2004. The West saw the second largest decrease in VMT per capita at 7.7 percent, followed by the Northeast at 7.4 percent, the South Gulf at 5.6 percent, and finally the North Central at 4.3 percent.
Frontier Group intern Danielle Elefritz contributed this blog post.
In prior work, Frontier Group research has demonstrated that the decline in per-capita driving over the last decade is a broad-based trend taking place in a variety of states and metropolitan areas across the United States. As the economy continues to recover, it is worth checking in on trends in per-capita VMT, using monthly traffic data for 2013 and population data from the Census Bureau.
The monthly data confirm that the trend toward lower per-capita driving remains broad based. While the South Atlantic region has seen the greatest decrease in VMT per capita since 2004, all five regions saw declines. Furthermore, only one region, the South Gulf, has had a meaningful uptick in per capita VMT data in the last few years as each of the other four regions saw driving either flatline or decrease in this same time period.
The Federal Highway Administration divides the U.S. into five regions—the Northeast,[1] the South Atlantic,[2] the North Central,[3] the South Gulf,[4] and the West.[5] Since 2004, the South Atlantic region saw the largest decrease in VMT per capita, declining 8 percent relative to 2004. The West saw the second largest decrease in VMT per capita at 7.7 percent, followed by the Northeast at 7.4 percent, the South Gulf at 5.6 percent, and finally the North Central at 4.3 percent.
All five regions have also seen declines in per-capita driving since the pit of the recession in 2009. Since 2011, the only region to see a meaningful uptick in per-capita VMT has been the South Gulf.
During the first five months of 2014, as Doug Short has noted, per-capita VMT has continued to fall, suggesting that the shifts in driving patterns Americans have demonstrated over the last decade are continuing, even amidst a more robust economic recovery.
[1] Connecticut, Maine, Massachusetts, New Hampshire, New Jersey, New York, Pennsylvania, Rhode Island, and Vermont
[2] Delaware, District of Columbia, Florida, Georgia, Maryland, North Carolina, South Carolina, Virginia, and West Virginia
[3] Illinois, Indiana, Iowa, Kansas, Michigan, Minnesota, Missouri, Nebraska, North Dakota, Ohio, South Dakota, and Wisconsin
[4] Alabama, Arkansas, Kentucky, Louisiana, Mississippi, Oklahoma, Tennessee, and Texas
[5] Alaska, Arizona, California, Colorado, Hawaii, Idaho, Montana, Nevada, New Mexico, Oregon, Utah, Washington, and Wyoming