

Before we decide to raise, or not raise, the MBTA’s fares, it is important that we understand how much we have already raised them.
On the MBTA, Riders Are Already Paying More
Gov. Baker’s special panel on the MBTA put forward many recommendations to address the agency’s fiscal problems, including raising fares.
MBTA riders, however, are already paying more for transit service than they did a decade and a half ago. Since 2000, MBTA bus and subway riders have seen fares double. The MBTA has raised fares, in the aggregate, faster than many other leading transit systems. And T riders have come to provide an increasing share of the MBTA’s operating funding.
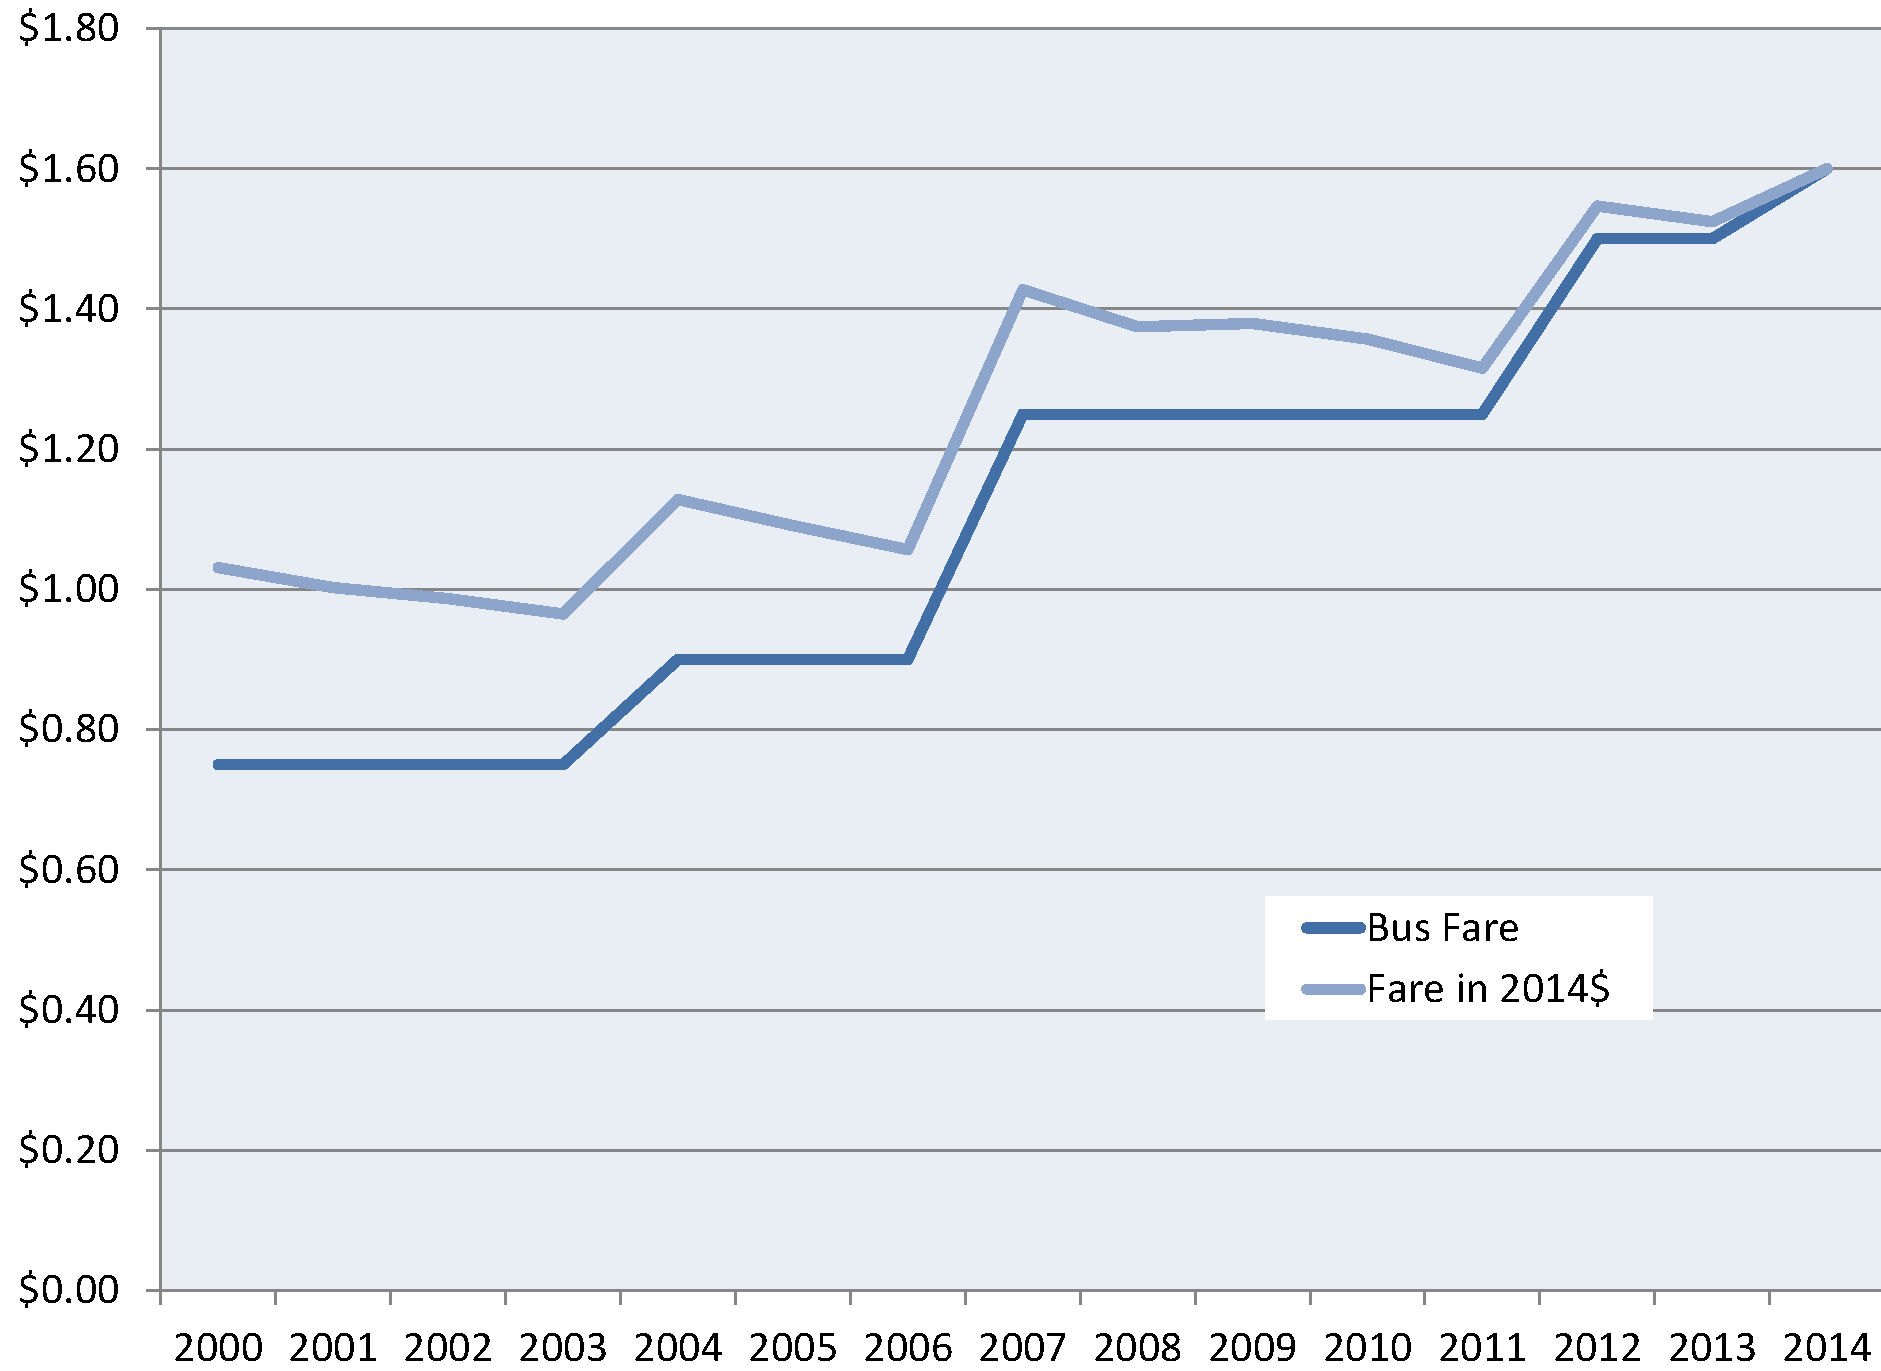
In 2000, the MBTA raised the individual subway fare to $1 (from 85 cents) and bus fare to 75 cents (from 60 cents), ending a period of nine years without fare increases. Since then, MBTA subway and bus fares have more than doubled in nominal terms and have increased by more than 50 percent when inflation is taken into account. (See Figures 1a and 1b.)
Figure 1a. MBTA Subway Fares[1]
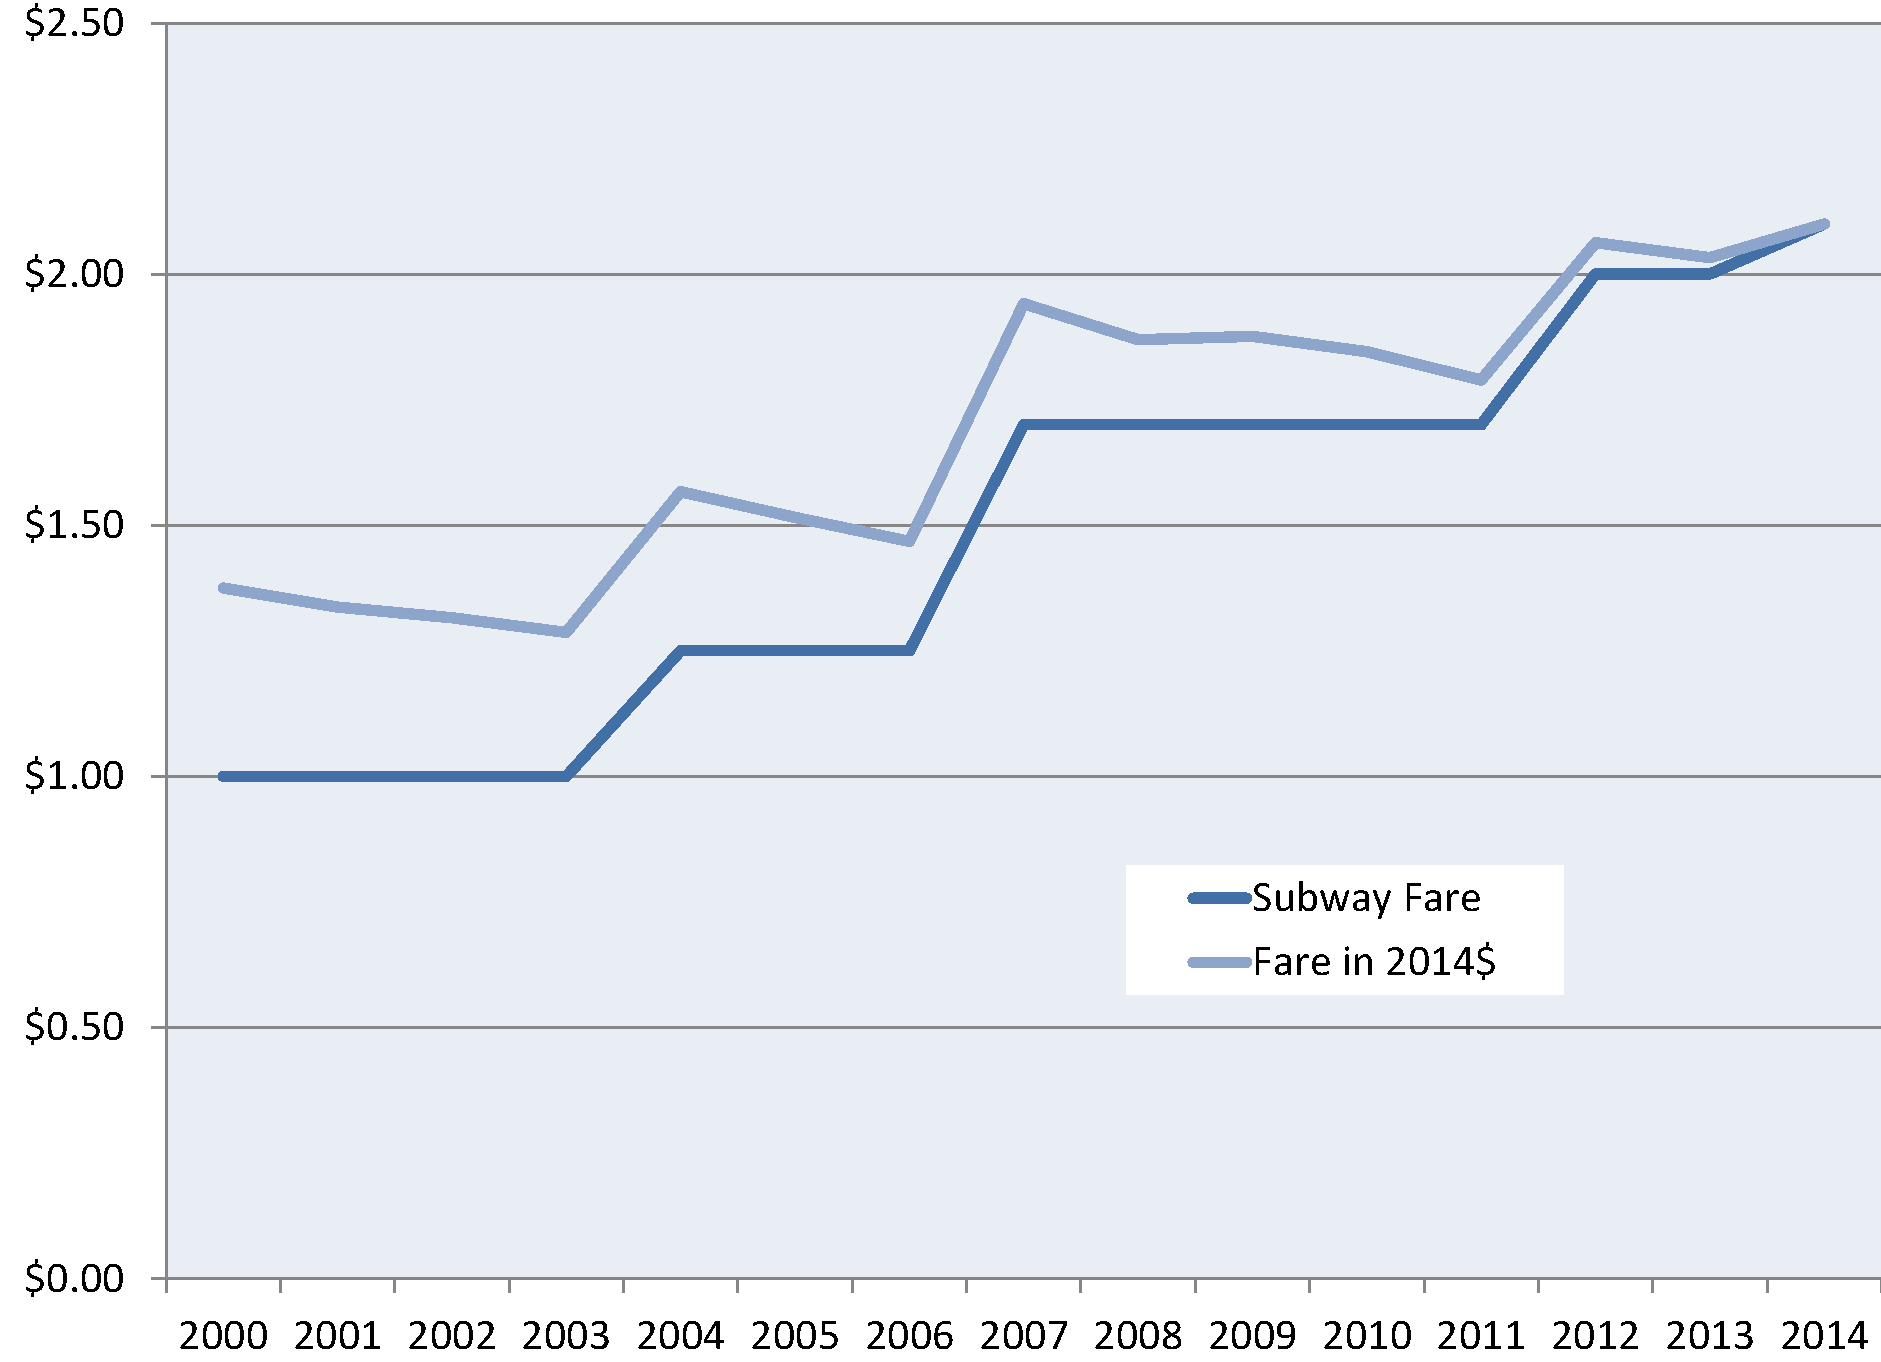
Figure 1b. MBTA Bus Fares
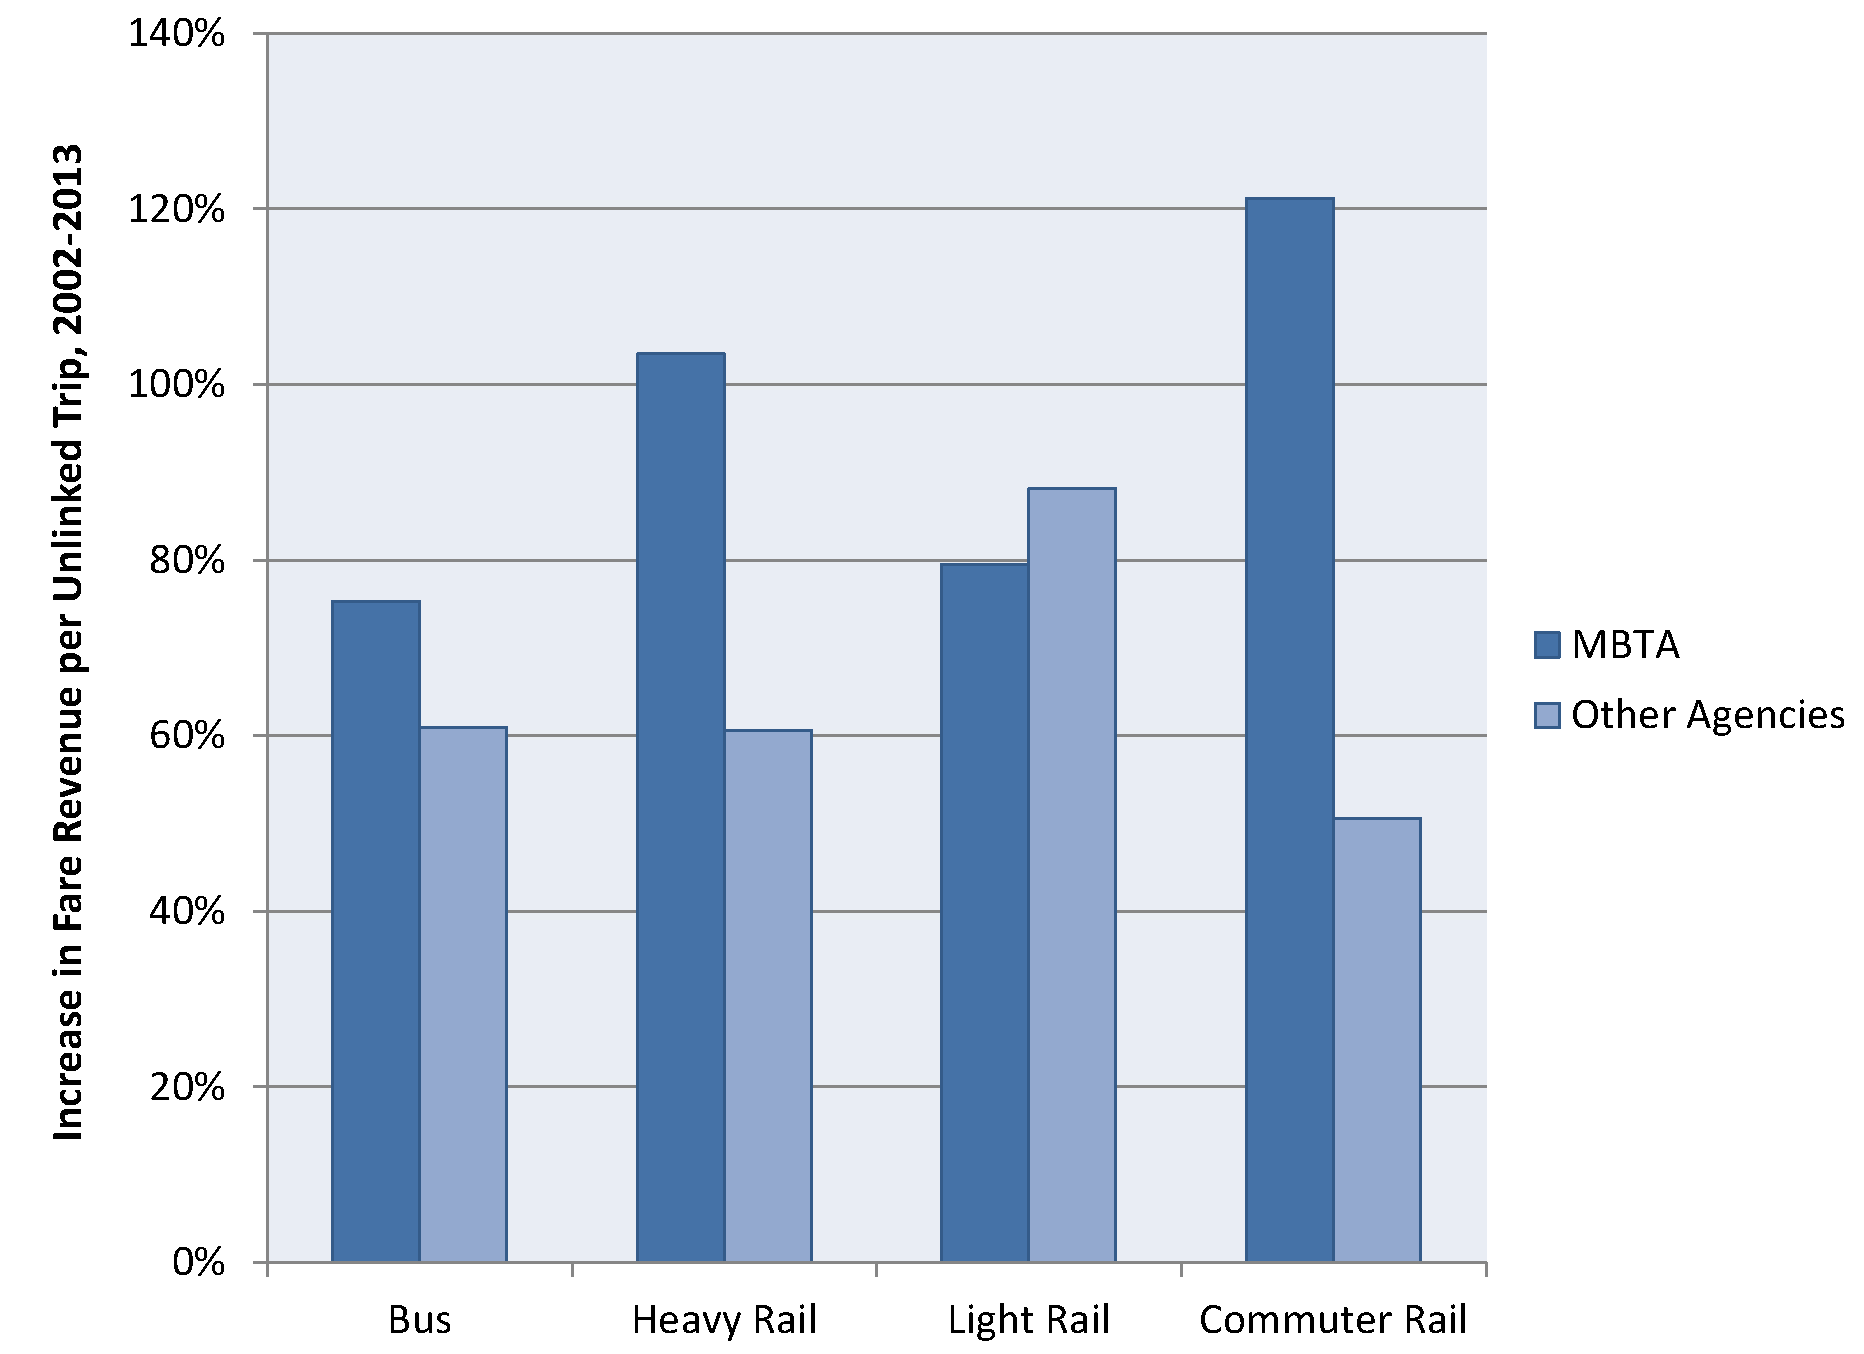
MBTA fares have increased faster than those of many other leading systems. Comparing fares across various transit systems can be difficult because of variations in fare policies, but the National Transit Database enables us to compare the amount of fare revenue received per trip across different agencies by mode of service. Using that measure, MBTA fares have increased faster than those of other leading agencies[2] for three types of transit service – bus, commuter rail and heavy rail (subway) – since 2002, with only light rail fare revenue increasing more slowly than the average of top agencies. (See Figure 2.)
Figure 2. Increases in Fare Revenue/Passenger Trip Since 2002, MBTA vs. Other Top Agencies
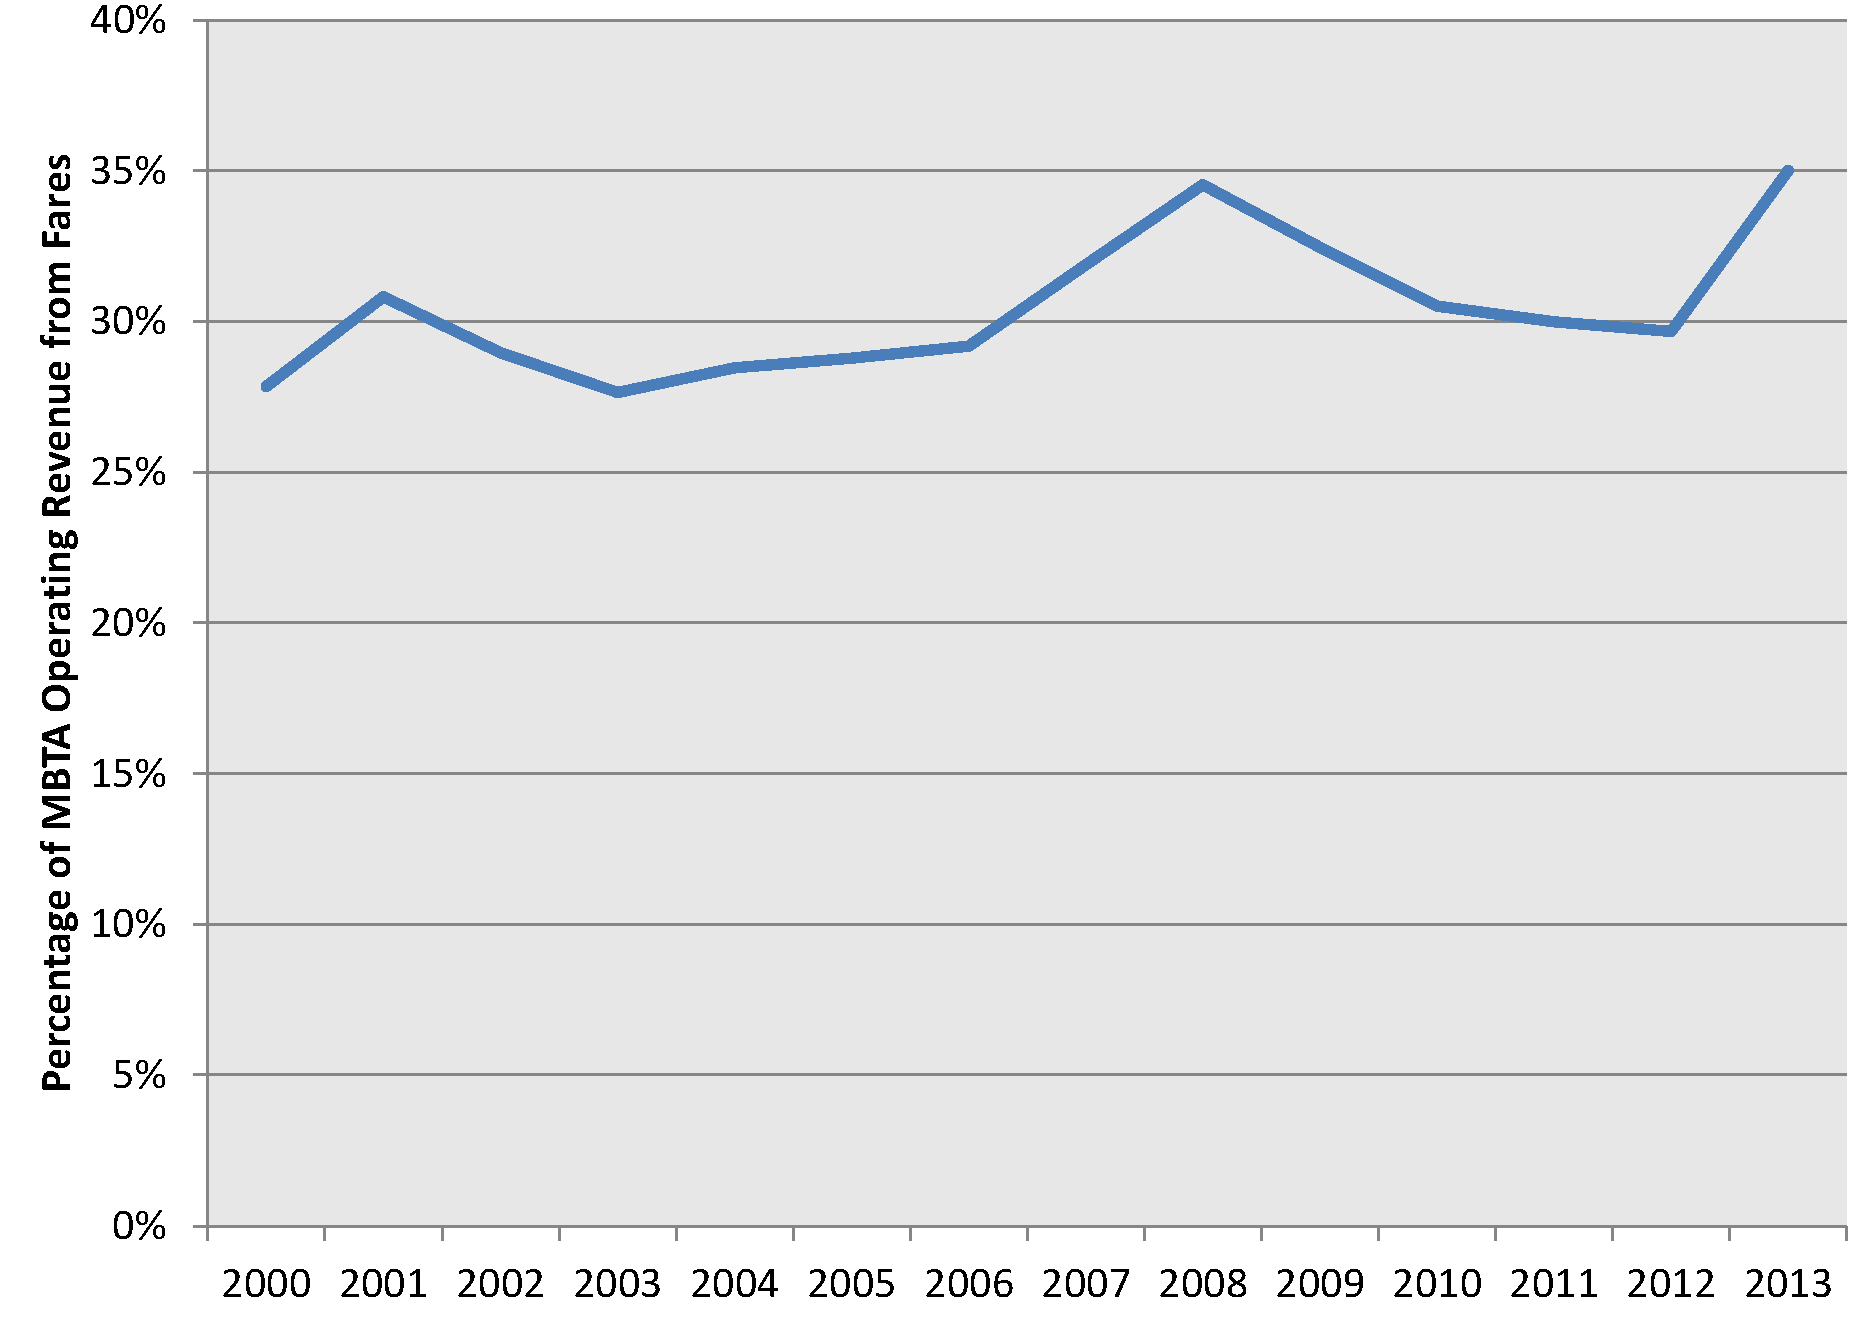
As fares have gone up, so too has the share of the T’s operating funding provided by riders. In 2013, fare revenue accounted for roughly 35 percent of the operating funds the MBTA took in from all sources, up from 29 percent in 2002. (See Figure 3.)
Figure 3. Fare Revenue as Share of Total Operating Funding (data from National Transit Database)
The question of whether MBTA riders are paying too much, too little, or just enough for the service they receive is one that can only be answered by first being clear about what we want our transit system to achieve. Do we prioritize having an MBTA that covers a greater share of its costs, or one that moves the greatest possible number of passengers? Regardless of how you answer that question, it is clear that MBTA riders are already paying more for the service they use than they did 10 or 15 years ago.
[1] Inflation adjustment based on Consumer Price Index. All fares assume use of CharlieCard; fares for paper tickets are higher.
[2] All data are from the National Transit Database. Comparative agencies for each mode are as follows: Bus: MTA NYC Transit, LA County Metro, CTA, SEPTA, NJ Transit, WMATA, and SF Muni. Only directly operated services were considered; Heavy rail: BART, WMATA, PATH, CTA, MTA, NYC Transit, MARTA, Miami-Dade Transit, SEPTA, LA Metro; Light rail: LA County Metro, SF Muni, TriMet, DART, Denver RTD, Utah Transit Authority, St. Louis Metro; Commuter rail: LIRR, Metro-North, NJ Transit, Metra, SEPTA, Caltrain, Metrolink, Maryland Transit Authority, VRE. In all cases, we used a non-weighted comparison of the MBTA’s fares versus those of other agencies. The use of figures weighted by ridership or revenue would have led to NYC transit services dominating many of the comparisons due to their extremely high ridership.
Associate Director and Senior Policy Analyst, Frontier Group
Tony Dutzik is associate director and senior policy analyst with Frontier Group. His research and ideas on climate, energy and transportation policy have helped shape public policy debates across the U.S., and have earned coverage in media outlets from the New York Times to National Public Radio. A former journalist, Tony lives and works in Boston.